The Fibonacci sequence is an infinite series of numbers in which each succeeding digit is equal to the sum of the preceding two – e.g. 0, 1, 1, 2, 3, 5, 8, 13, and so on.
In forex trading, technical indicators based on the Fibonacci sequence can be used to predict the future direction of a currency pair.
This beginner’s guide will explain what is Fibonacci in forex and explore how this sequence can be used when trading currencies.
What is Fibonacci in Forex?
Before getting into the details of what is Fibonacci in forex, we will first provide an overview of this sequence.
In a nutshell:
- Each number in this series is the sum of the two preceding ones.
- The sequence starts with a 0, then 1, followed by a series of steadily increasing numbers.
- So, the sequence would look like 0, 1, 1 (which equals 0 + 1), 2 (1 + 1), 3 (2 + 1), 5 (3 + 2), 8 (5 + 3), 13, 21, 34, 55, 89, and so on.
So, why is Fibonacci used in trading? The Fibonacci sequence is utilized as a way to find the support and resistance levels of a forex pair.
There are several technical indicators that are focused on this series, but the Fibonacci retracement level is the most commonly used tool in forex trading.
This indicator is best used when a forex pair is moving upwards or downwards – so that the trader can identify when the market could potentially reverse.
Fibonacci retracement is a strategy that can be used not only for trading forex but also for other asset classes – such as stocks and commodities. However, this indicator can be complex for a beginner, no matter the chosen financial market.
Therefore, we suggest that beginners get started by reading our guide on what is forex trading to gain a greater understanding of the currency market.
A Closer Look at Fibonacci Retracements
Fibonacci retracement is widely used in forex trading mainly because of its relative simplicity. In other words, Fibonacci retracement levels are horizontal lines that point out possible support and resistance levels.
- To understand what are forex Fibonacci levels, it is necessary to learn about one remarkable aspect of this numerical sequence.
- That is, each number in the Fibonacci series is around 1.618 times greater than the previous digit.
- This relationship between two numbers in the sequence forms the basis of the ratios in the Fibonacci retracement indicator.
The most commonly used Fibonacci ratio is 61.8% – which is found by dividing one number in the series by the next.
There are also other Fibonacci ratios that are produced using different types of mathematical relationships found in this formula. This includes 23.6%, 38.2%, 50%, 61.8%, 78.6%, 100%, and more.
So, how does the Fibonacci indicator work?
Here is a short explanation that can help clear the mist.
- A retracement line can be drawn between any two price points of a currency pair.
- After the line is plotted, the tool will automatically display the retracement levels.
- Each retracement level represents a percentage – like the ones we noted above.
- The percentage levels displayed are points where the price of the currency pair could flip.
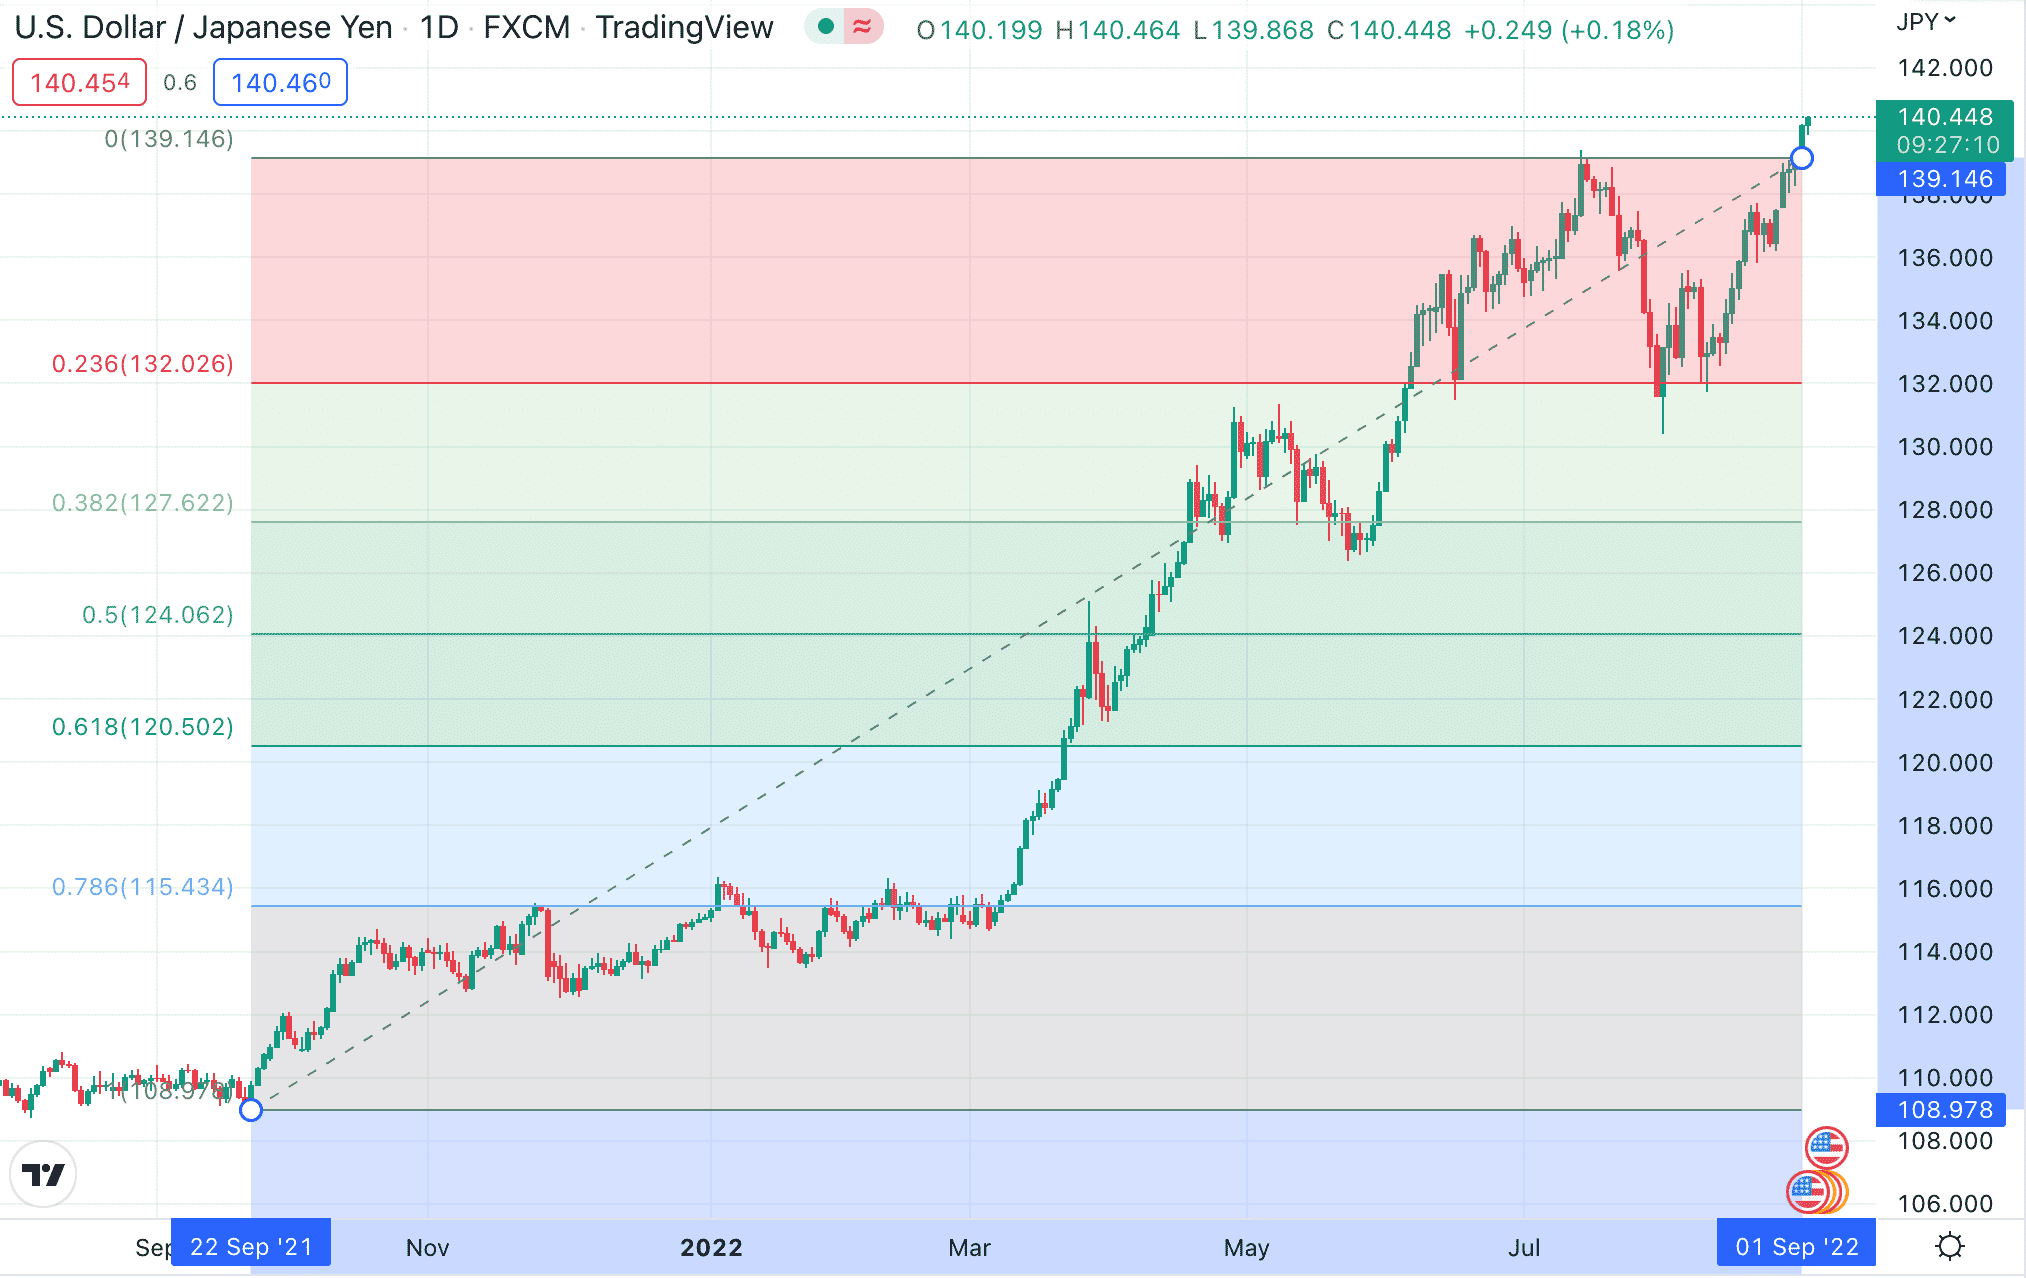
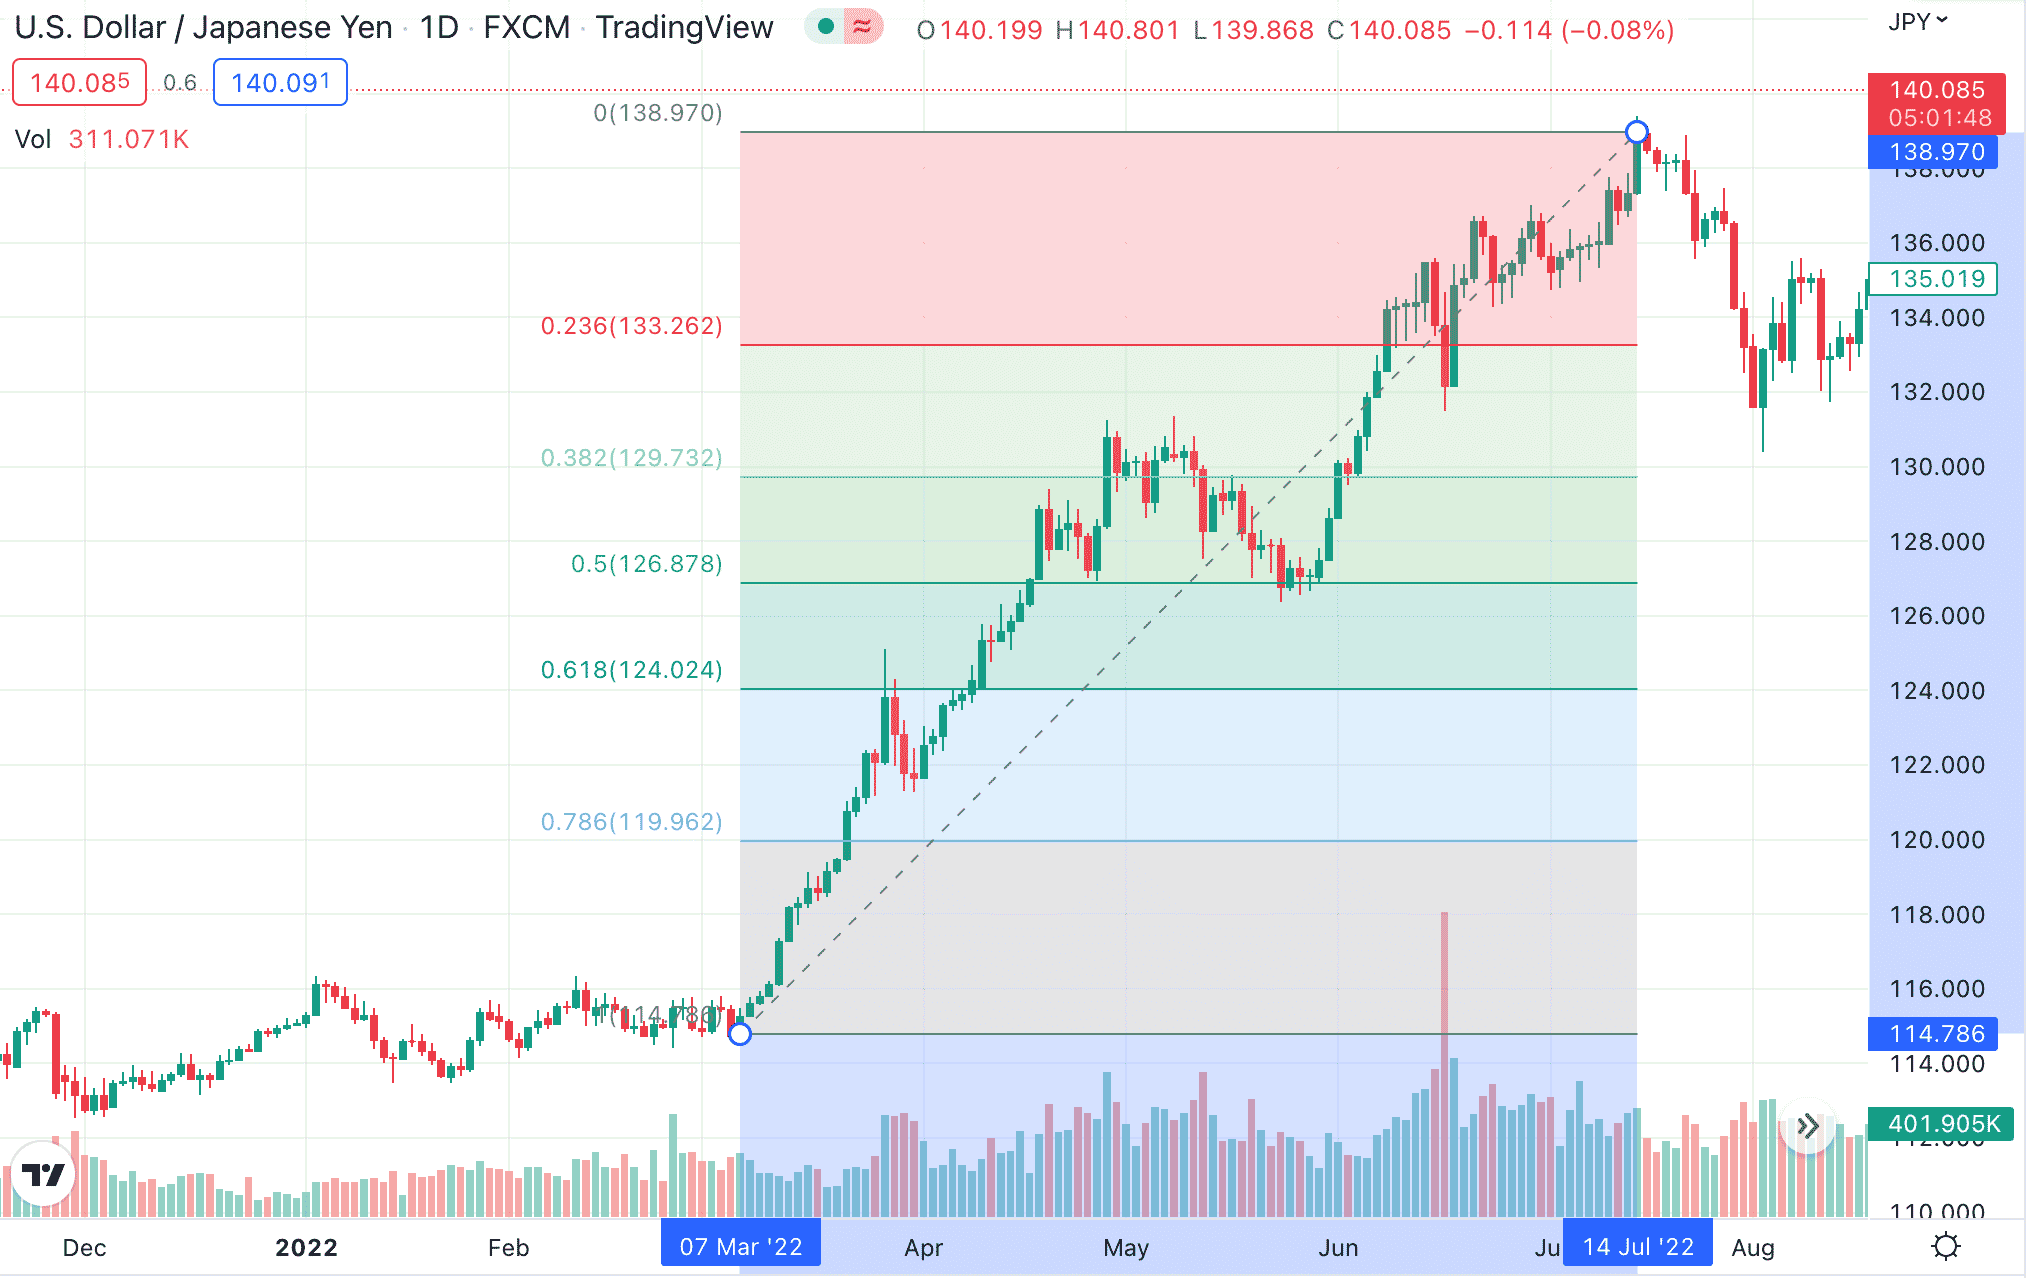
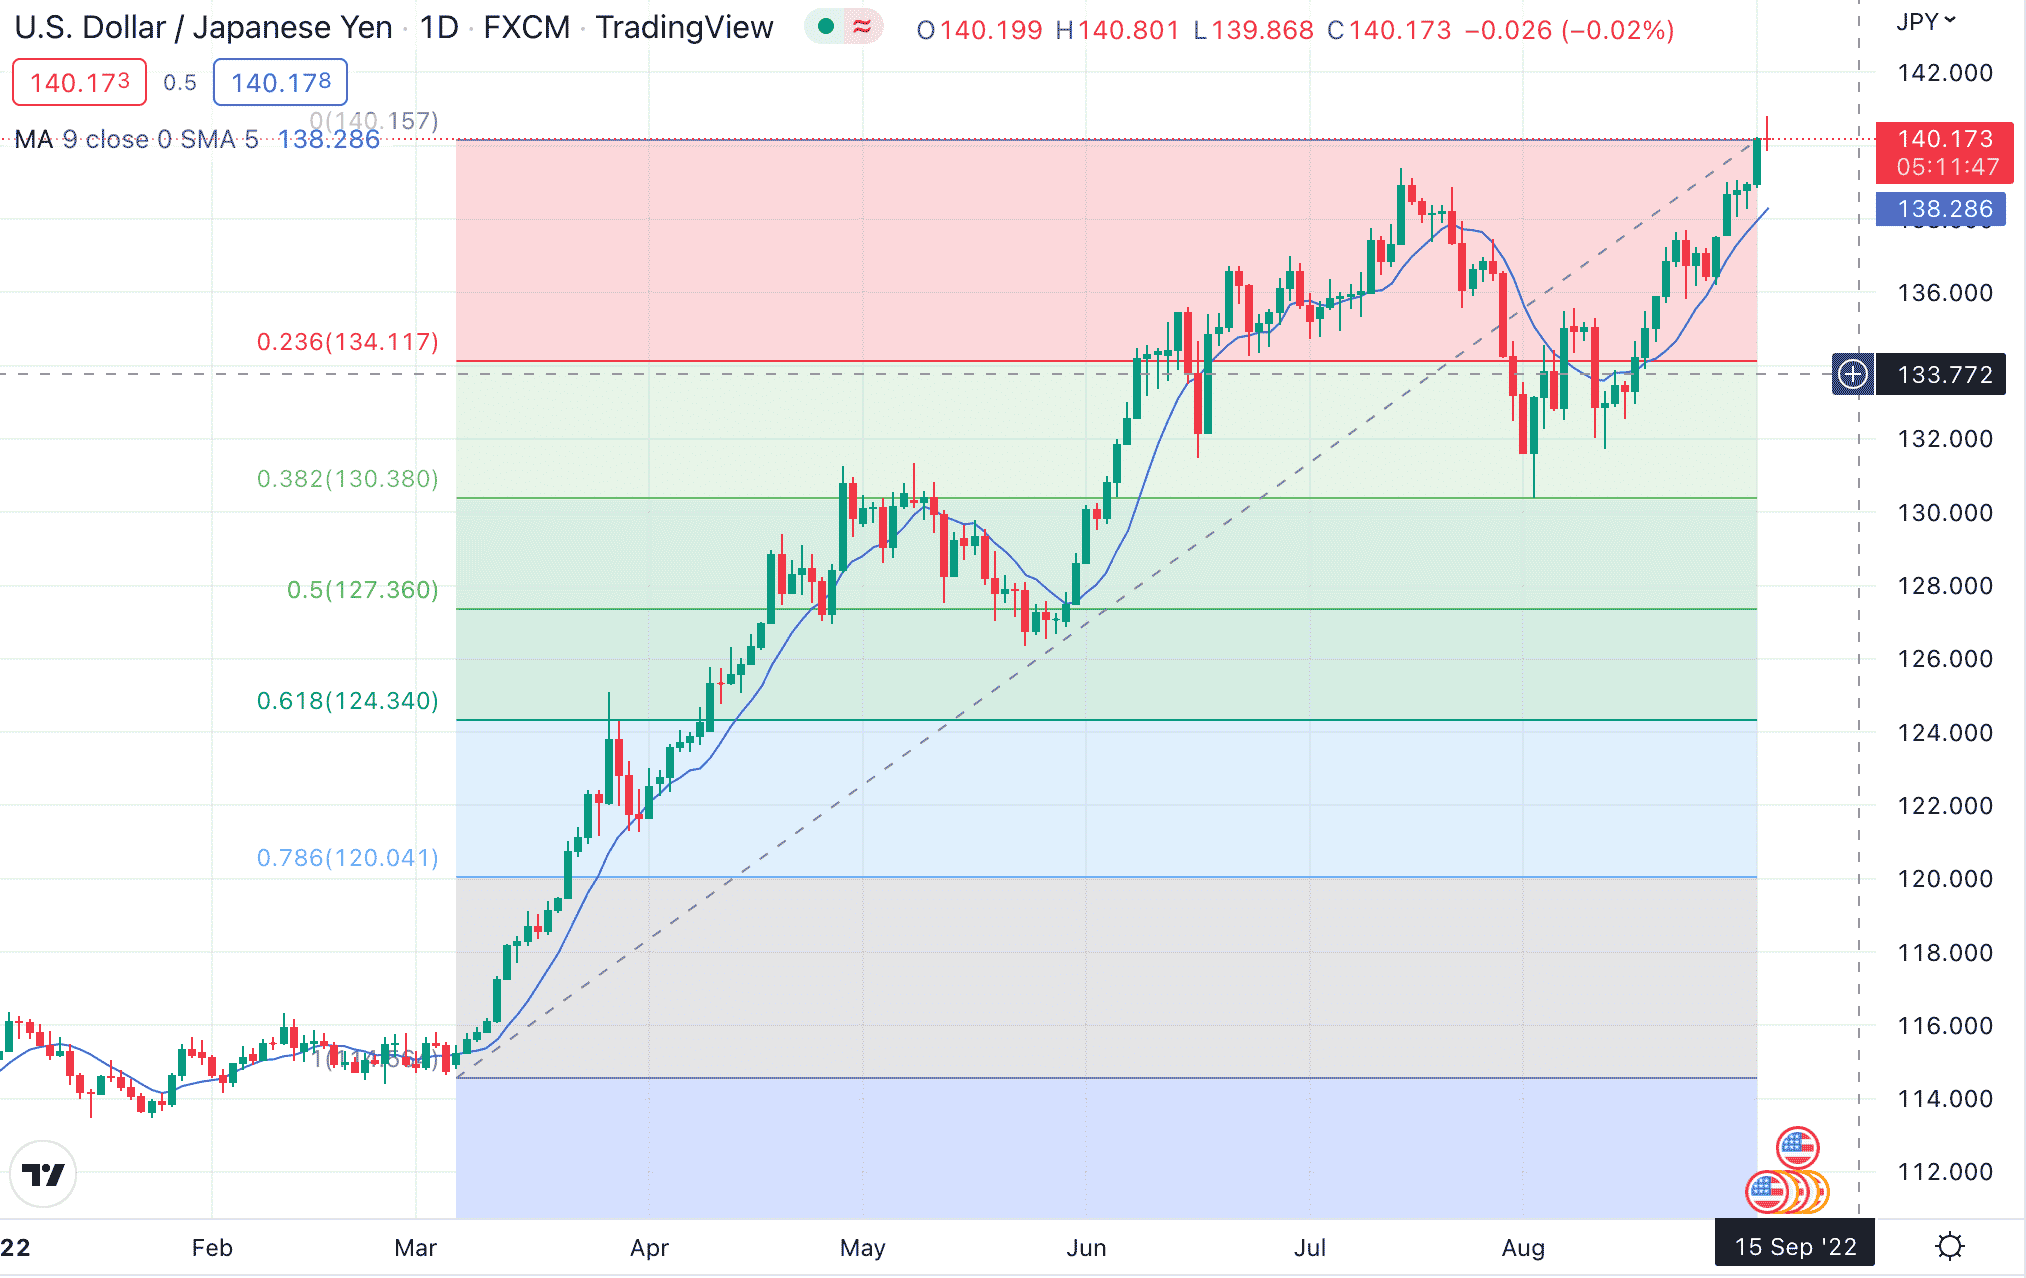
The following chart illustrates how a Fibonacci retracement appears for the forex pair USD/JPY during the broad uptrend between September 2021 and 2022.
As seen in the chart, each segment is divided into different levels based on Fibonacci ratios. The lines help traders identify when the direction of the forex pair might switch course.
That being said, these retracement levels should not be used as an exclusive indicator of price reversals. Instead, it is best to combine this strategy with other indicators or fundamental analysis methods before assuming a change in the price direction.
How to Use Fibonacci When Trading Forex
So, we have covered what is a Fibonacci in forex and how it can be used for drawing retracement lines.
- As we have established, in an uptrend, Fibonacci retracement levels act as support where the price may bounce and continue to climb up.
- Conversely, in a downtrend, Fibonacci levels can be viewed as resistance, where the price might bounce and go lower again.
So, how can a trader deploy this strategy?
Suppose that a trader sees the USD/JPY pair going through an uptrend.
- As per the chart above – after an upward movement, the pair retraces support to the 50% level.
- Then, it bounces and begins to climb again.
- Since the bounce happened at a Fibonacci level, the trader decides to place a ‘buy’ order.
- To manage the risk, the trader can opt for a take-profit level of 38.2%.
- Then the trader may place a ‘stop-loss’ order at the initial 50% or the lower 61.8% level – as a return back below this point could indicate that the trend has failed.
Different traders might use distinct levels of support/resistance. Therefore, the reasoning for using a specific Fibonacci level as ‘stop-loss’ or ‘take-profit’ will depend on the trader’s preference.
Why is Fibonacci Used in Forex?
Fibonacci is a mathematical concept that can be applied in many areas.
- In the context of forex trading, Fibonacci works because it allows traders to identify entry and exit points within trends.
- This strategy utilizes hard data and, as such, can minimize emotional interference in decision-making.
That being said, the use of Fibonacci in forex trading is very subjective and can be used to analyze the best pairs to trade in forex. Traders are at liberty to decide which levels they want to rely on, and this can alter the effectiveness of the strategy. However, that does not make this tool inherently unreliable.
Instead, this means that traders might have to use trial-and-error as a means to understand how to use Fibonacci in forex in order to generate consistent gains.
Moreover, it is always best to combine Fibonacci indicators with other research and analysis methods.
How is Fibonacci Calculated?
The best forex brokers in the market offer a handy tool that automatically draws Fibonacci retracement lines. To get started, a trader can choose any prominent points from the chosen forex pair’s chart.
- Typically, traders pick the highest and lowest points over a set period of time.
- Then, the trading platform will automatically draw the retracement levels, splitting the vertical distance by the Fibonacci ratios.
- When these levels are identified, traders can spot the different trading opportunities in the market.
That being said, a Fibonacci retracement is considered to be most accurate across longer time periods. To elaborate, a 61.8% retracement on a monthly chart will be better when compared to a 5-minute price interval.
That being said, the chosen timeframe will indeed depend on the type of trading strategy.
For instance, scalpers might be looking for retracement levels for short intervals within a day, whereas swing traders might prefer longer time frames. In order to increase the accuracy, Fibonacci retracement has to be used in conjunction with other technical indicators.
It is also worth noticing that although Fibonacci has several ratios, it is the 38.2%, 50%, and 61.8% levels that are most commonly used by traders. Some traders also consider 23.6% and 78.6% as notable levels to incorporate in their analysis.
Limitations of Fibonacci in Forex
The forex Fibonacci numbers and ratios can be useful in finding support or resistance.
However, the catch is that there is no assurance that the price movement will actually stop at those levels. This might mean that the trader misses out on an additional profit stream or worse – they end up closing the position at a loss.
Moreover, considering how many Fibonacci levels are accessible, traders might struggle to know which one to use at a given time.
This is why it is important to use other confirmation signals so that the trader can arrive at their decisions armed with more data.
Other Forex Strategies
Fibonacci is best used in combination with other technical analysis tools.
Therefore, in this section of our guide, we will cover some alternative strategies that are utilized hand-in-hand with Fibonacci indicators.
Moving Average
Moving average is a technical indicator that helps traders identify the trend of a forex pair. This indicator calculates the average price range of a forex pair during a specific period of time.
While Fibonacci retracement levels remain constant, moving averages tend to be dynamic.
When combining moving averages and Fibonacci retracement lines, a trader looks for crossovers. That is – the point where the moving average touches a Fibonacci level.
If and when this happens, the trader may open a position in the direction of the trend.
Trend Trading
Fibonacci retracements can also be used with trend trading. In this method, traders try to identify the future direction of the forex pair. Then, they opt for a long or short position based on their analysis findings.
- After identifying a trend, it is important to establish key support and resistance levels.
- This is where Fibonacci retracement levels can be of help.
- Traders can use these levels in order to decide when to enter and exit a position – regardless of whether the market is following an uptrend or a downtrend.
Other Fibonacci Strategies
In addition to Fibonacci retracement levels, there are several other charting tools based on this mathematical sequence.
Some of these include:
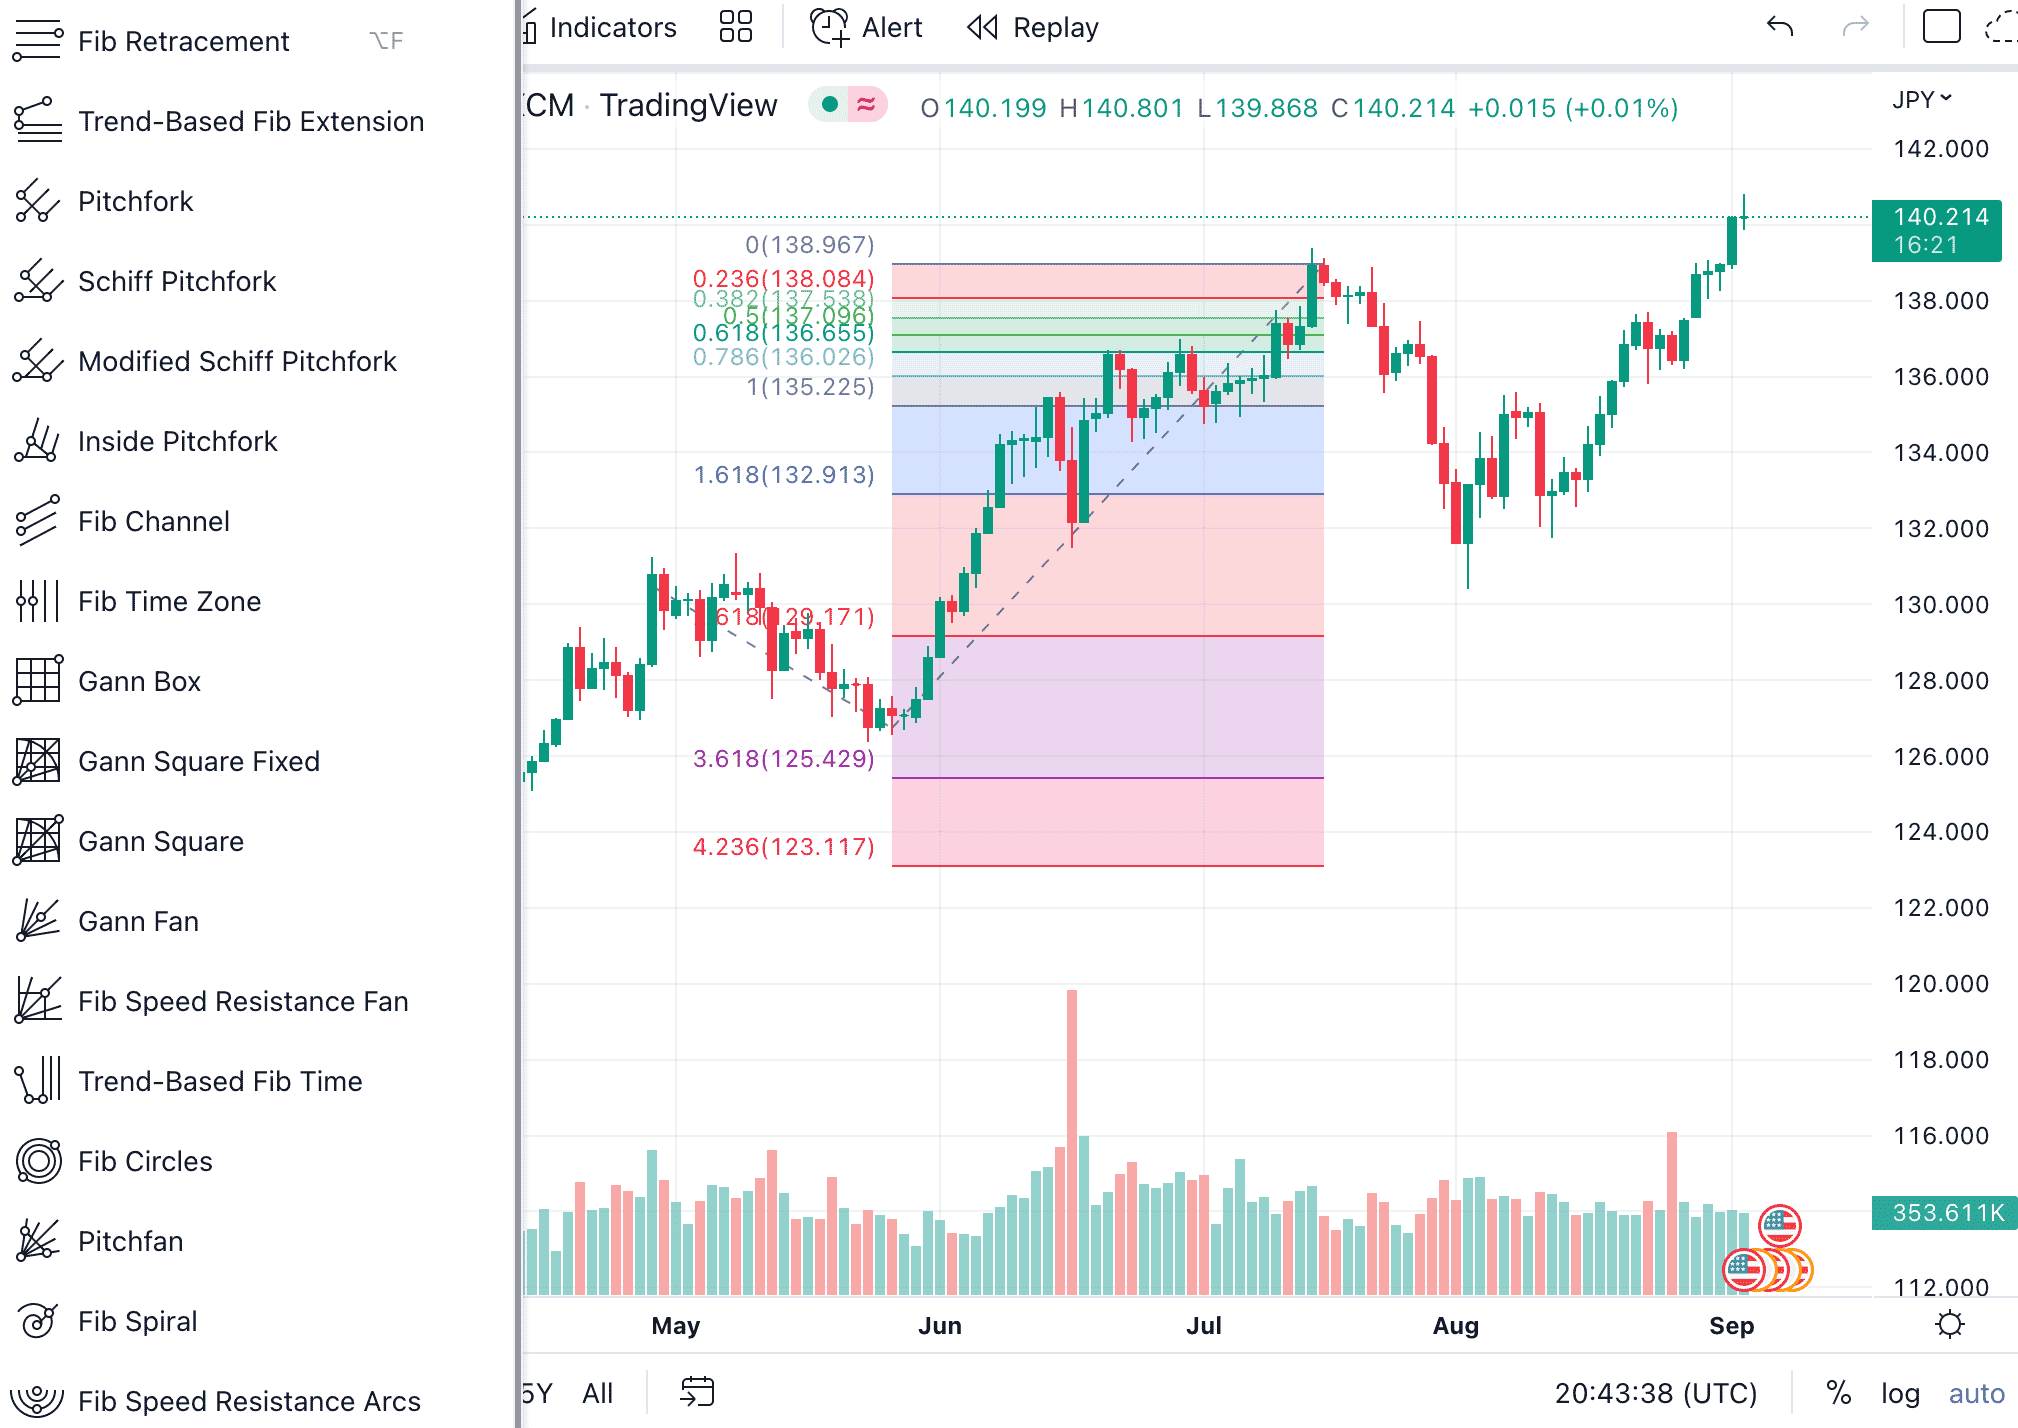
- Fibonacci extension – Allows traders to estimate how far the price may move after a pullback is finished.
- Fibonacci channel – A variation of retracement levels with diagonal lines.
- Fibonacci circles – Levels denoted in half circles extending from a trend line drawn between two extreme points.
- Fibonacci time zones – Vertical lines that show potential areas where a high, low, or reversal could occur.
- Fibonacci wedge – A set of arcs spreading out of the point of a trend’s commencement.
As is evident, Fibonacci forex trading can be very creative, and there is plenty of room for traders to find a specific strategy that works best for them.
Nevertheless, Fibonacci retracement levels continue to be one of the most widely used drawing tools among forex traders.
Long-term and Short-Term Forex Strategies
Now that we have the Fibonacci forex explained, it should be clear that this strategy can be applied to both long-term and short-term trading styles. This includes time frames of mere minutes to years.
However, due to the nature of the forex market, the majority of trades are executed on a short time horizon. Below, we have listed some of the most popular forex trading strategies that utilize Fibonacci retracement levels as confirmation:
- Scalp trading – Scalpers try to take advantage of intraday price moves of a currency pair with positions that last for seconds or minutes. Scalpers usually look for the best scalping brokers to make the most of intraday market movements.
- Day trading – Like scalpers, day traders also look for short-term opportunities, but positions might remain open for a few hours. However, day traders do not keep a position open for more than a day.
- Swing trading – Swing traders attempt to make gains from the intra-week or intra-month price oscillations of a forex pair. In this strategy, the trader might keep their positions open for several days; however, they will be exposed to enhanced volatility that is typically seen overnight and across the weekend.
Apart from the above, there are other strategies that are used by forex traders.
The majority of strategies use technical tools and indicators to form trading decisions nonetheless. And with most of these strategies, the Fibonacci retracement levels can be a handy tool to find support and resistance levels.
However, it is also possible to trade forex based on socio-economic conditions. This could be anything from a central bank meeting to a political crisis. For instance, the Russia-Ukraine war has had a severe impact on the forex market, driving inflation.
Ultimately, the best forex trading strategy will depend on the style of the trader.
Where to Trade Forex with Tight Spreads – Popular Forex Platforms Reviewed
In this guide, we have covered what is Fibonacci trading and how this strategy can be used in the forex market. Now, let us explore which brokers are the best for forex trading.
Below we review two popular brokers – both of which offer low spreads, technical analysis tools, and access to a wide range of forex pairs.
1. Capital.com – Trade Currency Pairs at 0% Commissions
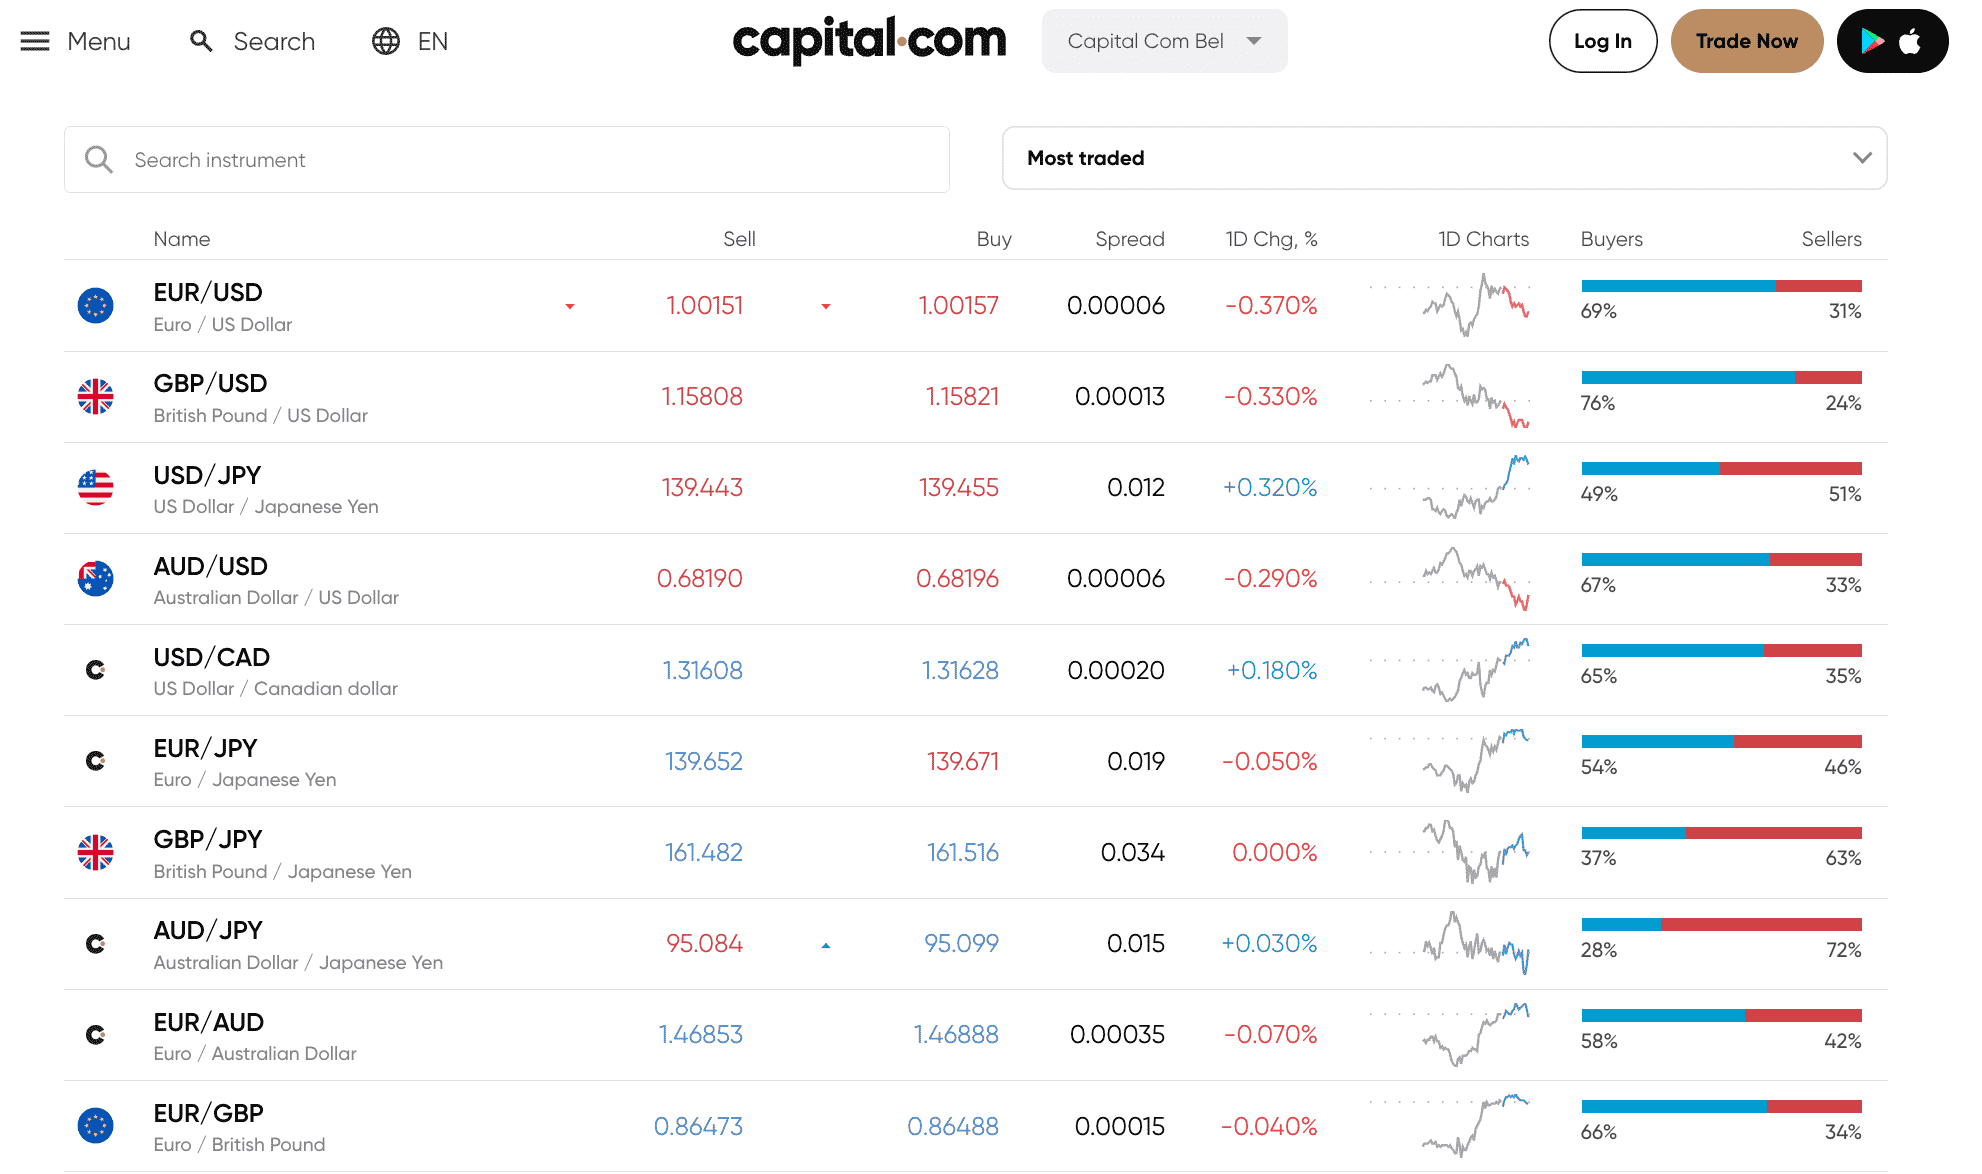
Capital.com stands out for its listing of 138 forex pairs, which includes a sizable selection of exotics. This online trading platform deals with CFDs, making it easy for forex traders to open both long and short positions. Moreover, Capital.com is a commission-free provider that facilitates low-cost forex trading.
This platform offers access to advanced charting tools, including Fibonacci retracement levels. There are also dozens of other technical indicators on offer. Additionally, Capital.com’s trading platform uses artificial intelligence, which aims to help traders spot trends in the forex market.
Although Capital.com does not charge any commission, forex traders will still need to cover the spread – which starts at 0.6 pips. For more information on Pips you can read our guide on what is a Pip in forex right now. Moreover, swap fees will also apply for positions held open overnight. The overnight fee will vary from one currency pair to the next and will also depend on the size of the position.
Another attractive feature of this platform is that it does not charge any deposit or withdrawal fees. Moreover, this platform supports multiple payment methods, including bank transfers, credit/debit cards, and e-wallets. Bank transfers demand a minimum deposit of $250, whereas, for other supported payment methods, this requirement is reduced to just $20.
While Capital.com is a popular forex trading platform, this isn’t the only asset class accessible. Capital.com lists over 6.100 markets via CFDs – which include stocks, commodities, indices, ETFs, and cryptocurrencies. This Capital.com review should also note that the platform promotes education and thus – offers many guides on different aspects of investing.
The broker also offers its users access to demo accounts to practice trading with paper money. It also integrates with MT4 as well as TradingView to provide all resources necessary for forex trading. Most importantly, Capital.com is regulated by not one but four financial authorities – including FCA, NBRB, CySEC, and ASIC.
| Number of forex pairs | 138 |
| Minimum pip size | 0.6 pips |
| Leverage | 1:30 for retail clients |
| Cost of trading USD/JPY | 0.8 pip spread + any overnight fees applicable |
| Deposit Fee | Free |
| Overnight fees | Yes, calculated based on the currency pair and size of the position. Swap-free Islamic accounts are also available. |
80.61% of retail investor accounts lose money when trading CFDs with this provider.
2. eToro – Top Forex Copy Trading Platform with Tight Spreads

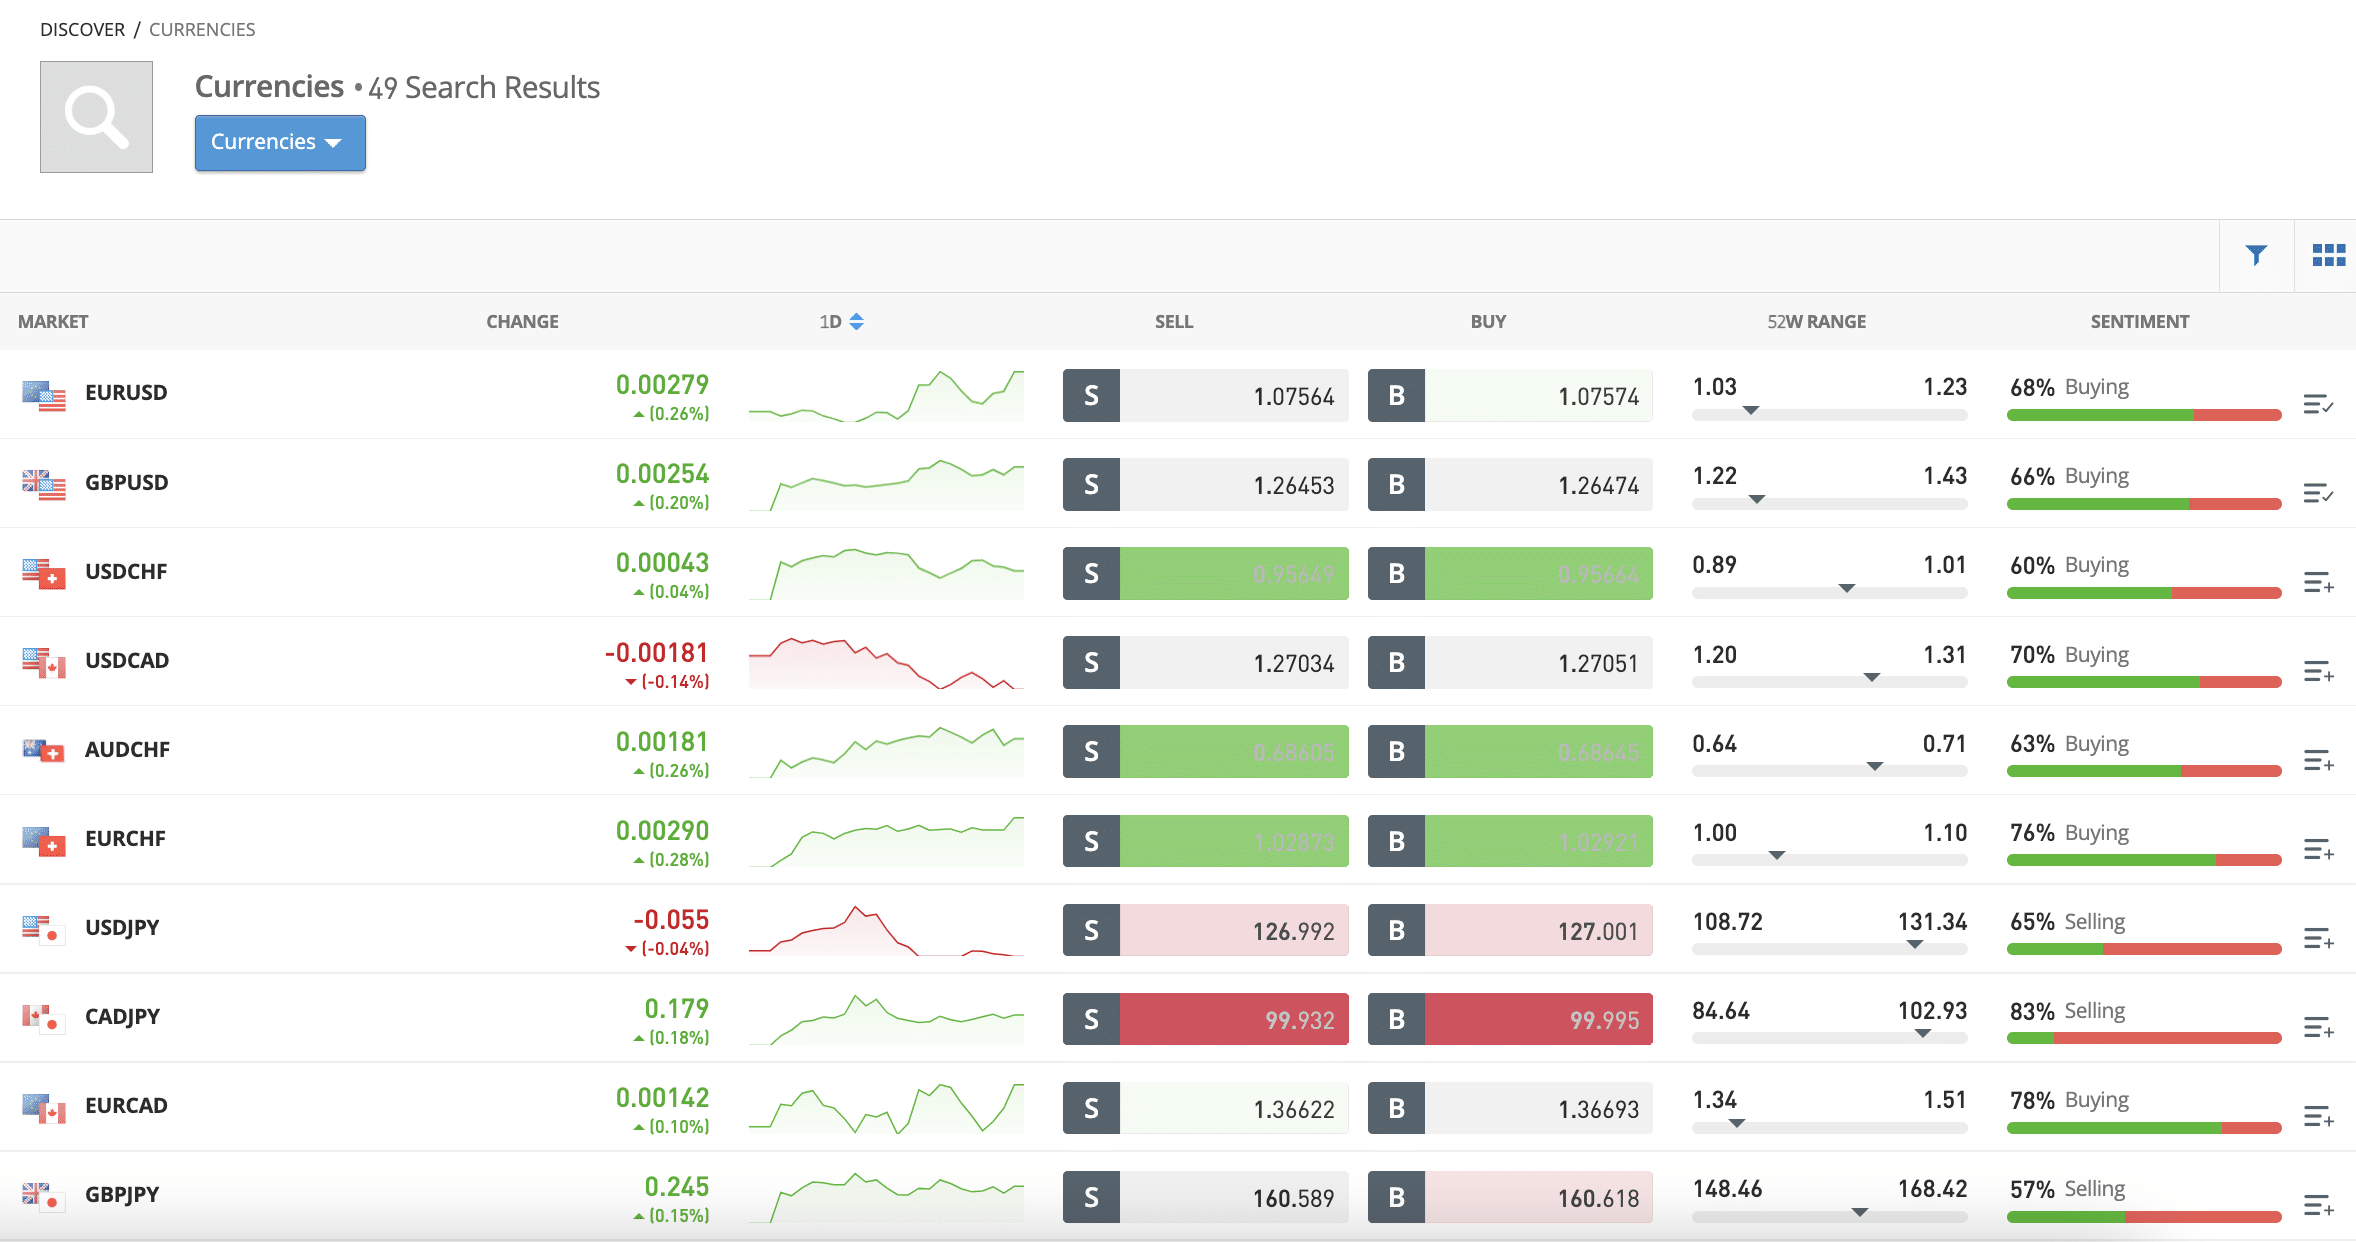
The most useful feature of eToro is Copy Trading – which allows users to mirror the forex positions of other traders on the platform. This way, beginners can benefit from the expertise of experienced traders without requiring in-depth knowledge of Fibonacci forex trading or other technical indicators.
Nonetheless, the trading platform also offers price charts that help traders analyze the historical performance of a currency pair. In addition to this, eToro comes with in-built drawing tools and indicators for conducting technical analysis. Users can also monitor market updates via eToro’s news feed.
eToro is also a commission-free stock broker, but it does charge spreads – which are typically competitive. It also processes USD deposits for free, and other fiat currencies are charged a nominal FX fee of 0.5%. In addition to this, CFD positions will also be charged an overnight fee.
When it comes to funding methods, eToro supports debit/credit cards, e-wallets, and bank transfers. The minimum deposit amount is only $10 for US and UK traders and $50 for users from others countries. The platform also offers demo accounts and an extensive library of trading guides.
Learn more about this forex broker by reading our full eToro review.
| Number of forex pairs | 49 |
| Minimum pip size | 1 pip |
| Leverage | 1:30 for retail clients |
| Cost of trading USD/JPY | 1 pip spread + any overnight fees applicable |
| Deposit Fee | Free on USD deposits, 0.5% for other fiat currencies |
| Overnight fees | Yes, calculated based on the size of the position. Swap-free Islamic accounts are also available. |
78% of retail investor accounts lose money when trading CFDs with this provider.
Conclusion
This guide has discussed what is Fibonacci in forex and the role of this sequence when trading currencies. Put simply, Fibonacci ratios can be used to find support and resistance levels, helping traders to determine when to open and close a forex position.
Forex brokers such as Capital.com come with in-built indicators and demo accounts – which include the Fibonacci retracement. Such features can be immensely helpful for traders to develop forex strategies without having to switch between platforms.
Moreover, Capital.com supports MT4 and TradingView, offering a trove of resources for technical forex traders. This platform also lists an extensive selection of markets, which includes 138 forex pairs at 0% commission.
Your capital is at risk. 80.61% of retail investor accounts lose money when trading CFDs with this provider.
