In financial markets, a trend is the general direction in which the price of an asset moves. Trend trading is a method used by investors to identify these broad price movements in order to capture gains.
In this guide, we explain what is trend trading – covering the methodology in detail. We will also explore popular brokers that investors can use to start trend trading today.
What is Trend Trading?
Trend trading is a strategy used to identify the direction of market momentum. In this method, the investor analyses the future price direction of an asset and then places a trade accordingly.
This definition can be confusing, especially for beginner traders.
So, let us break this down into simpler terms:
- Suppose the price of an asset is increasing over a certain period of time.
- This is generally viewed as an upward trend.
- When such a trend occurs, traders might enter a long position.
- This means to buy low and sell high – thereby generating a profit in the process.
- On the other hand, the price of the asset can also decline – indicating a downward trend.
- If this happens, the trader might opt to enter a short position.
The goal is to understand how the price of an asset will move in the future and how long the existing trend will last.
With trend trading, the hardest part is not opening a position but rather closing it at the right time. A trend may reverse at any point, and unless the trader closes the position before that – they might be forced to close the trade at a loss.
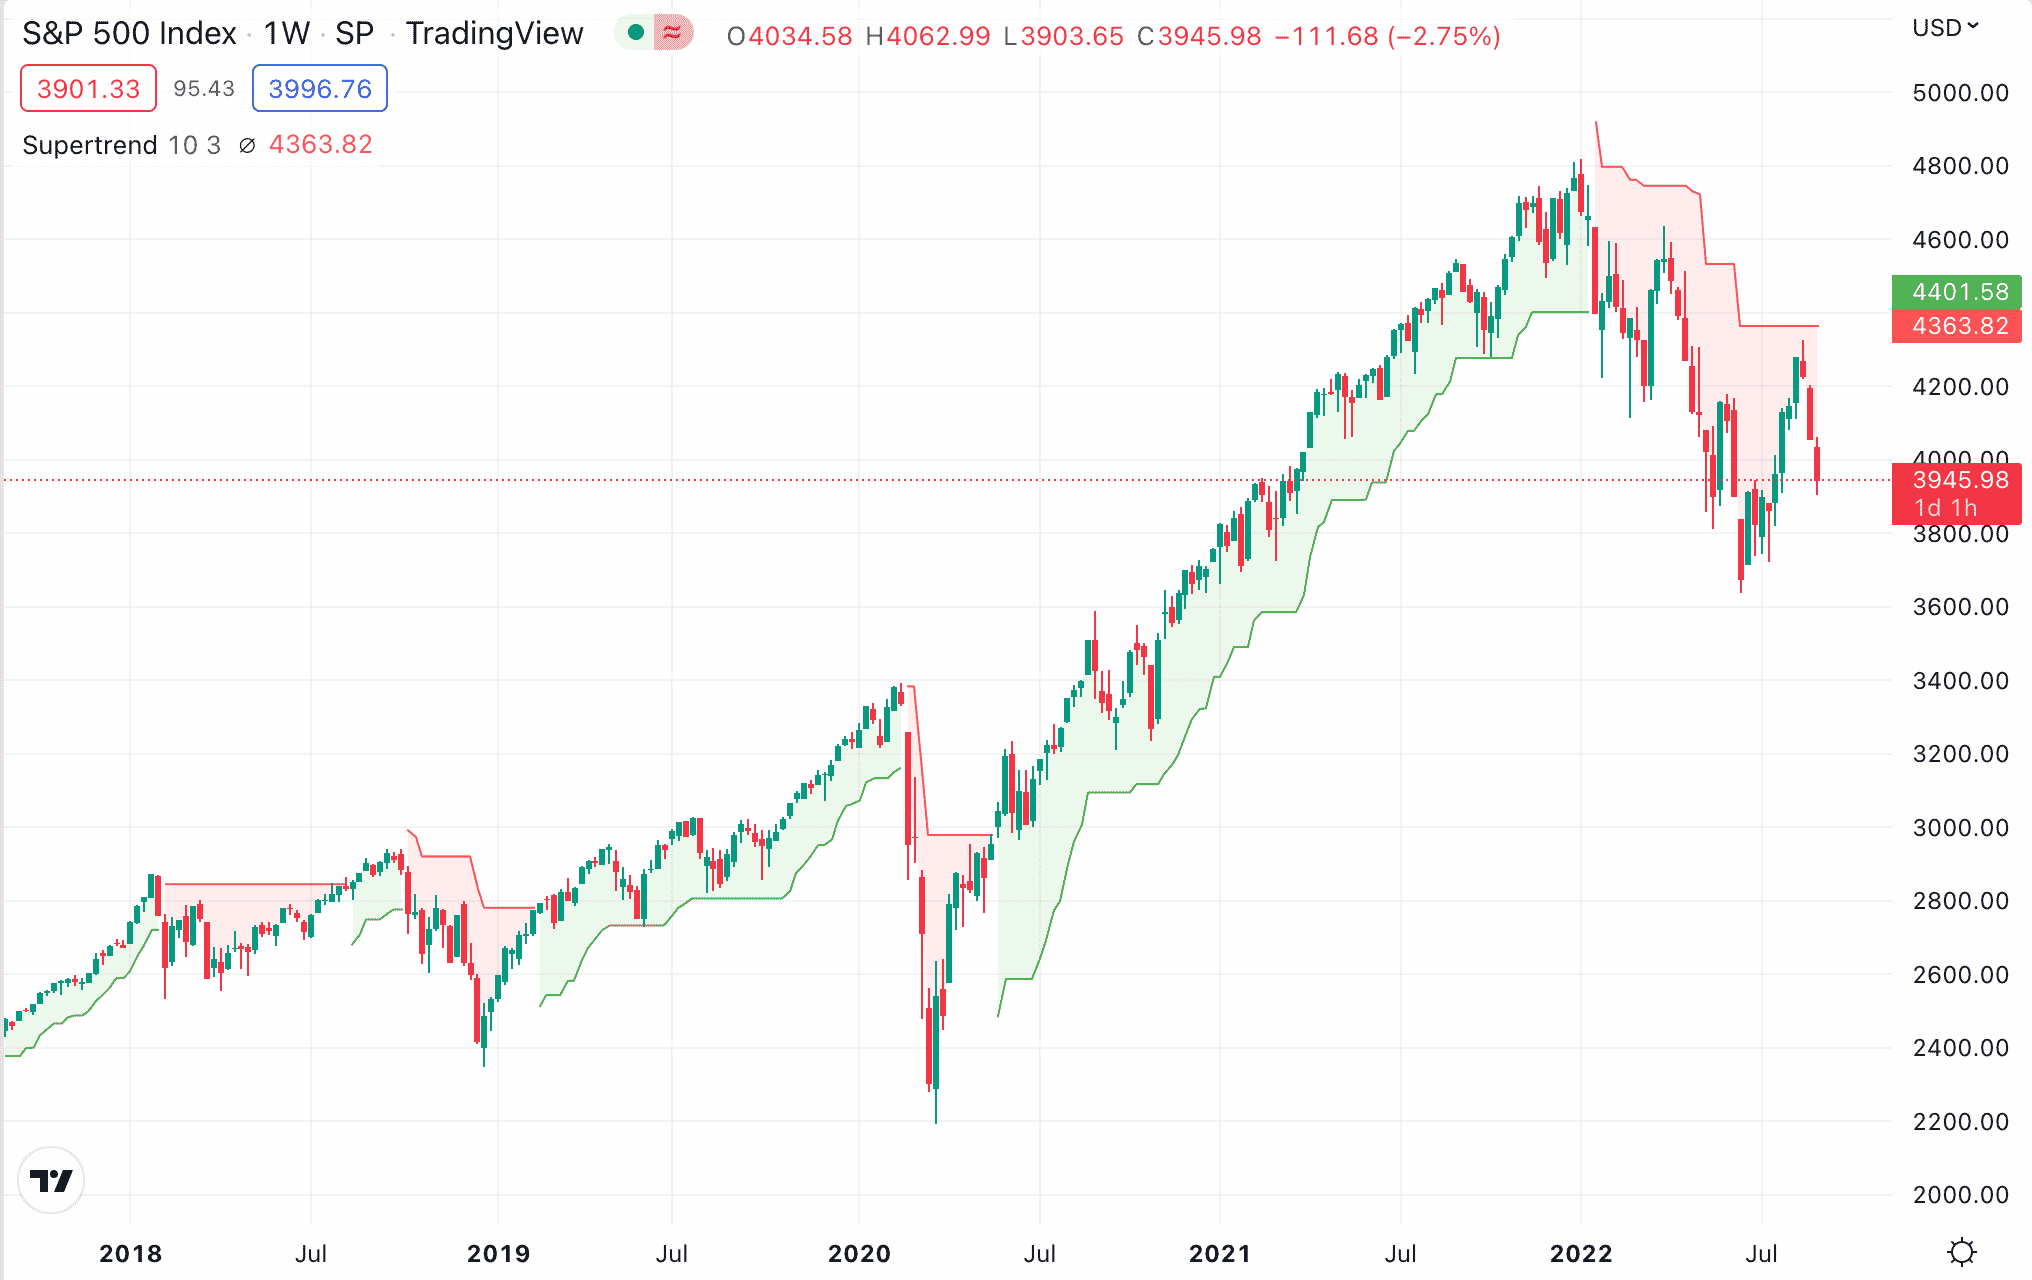
To give an example of trends, let us take consider the price history of the S&P 500 index over the previous five years. In the chart below, the green portion represents the broad bullish market (uptrend), and the red part denotes the bearish phase (downtrend).
As seen, the S&P 500 went through an uptrend throughout 2019. Then again, we can find an uptrend from mid-2020 until the end of 2021. In between, the index has also gone through several downtrends.
The chart above focuses on the wider market trends. However, it is clear that no asset moves straight up or down. There will indeed be oscillations – but for a trend to form, the overall movement needs to be in the same direction.
- Making investment decisions based on trends can turn out to be profitable – given that the trader knows the right time to close the position.
- Moreover, trend trading is a strategy that can be applied across all asset classes – from stocks and forex to commodities and cryptocurrencies.
However, trend trading can also be risky, as with all other strategies. In the following sections of our guide, we will dive into the details of what is trend trading in much more detail.
How Does Trend Trading work?
Trend trading is based on a simple hypothesis – when an asset enters a trend, it will continue in that direction for a certain period of time.
Spotting a trend before it occurs or just as it is forming allows investors to get in on the action early – and potentially generate a profit.
When learning how to trend trade, investors should first get the basics right. Below, we take a closer look at three core types of trends and how a trader can make the most of them.
Uptrend
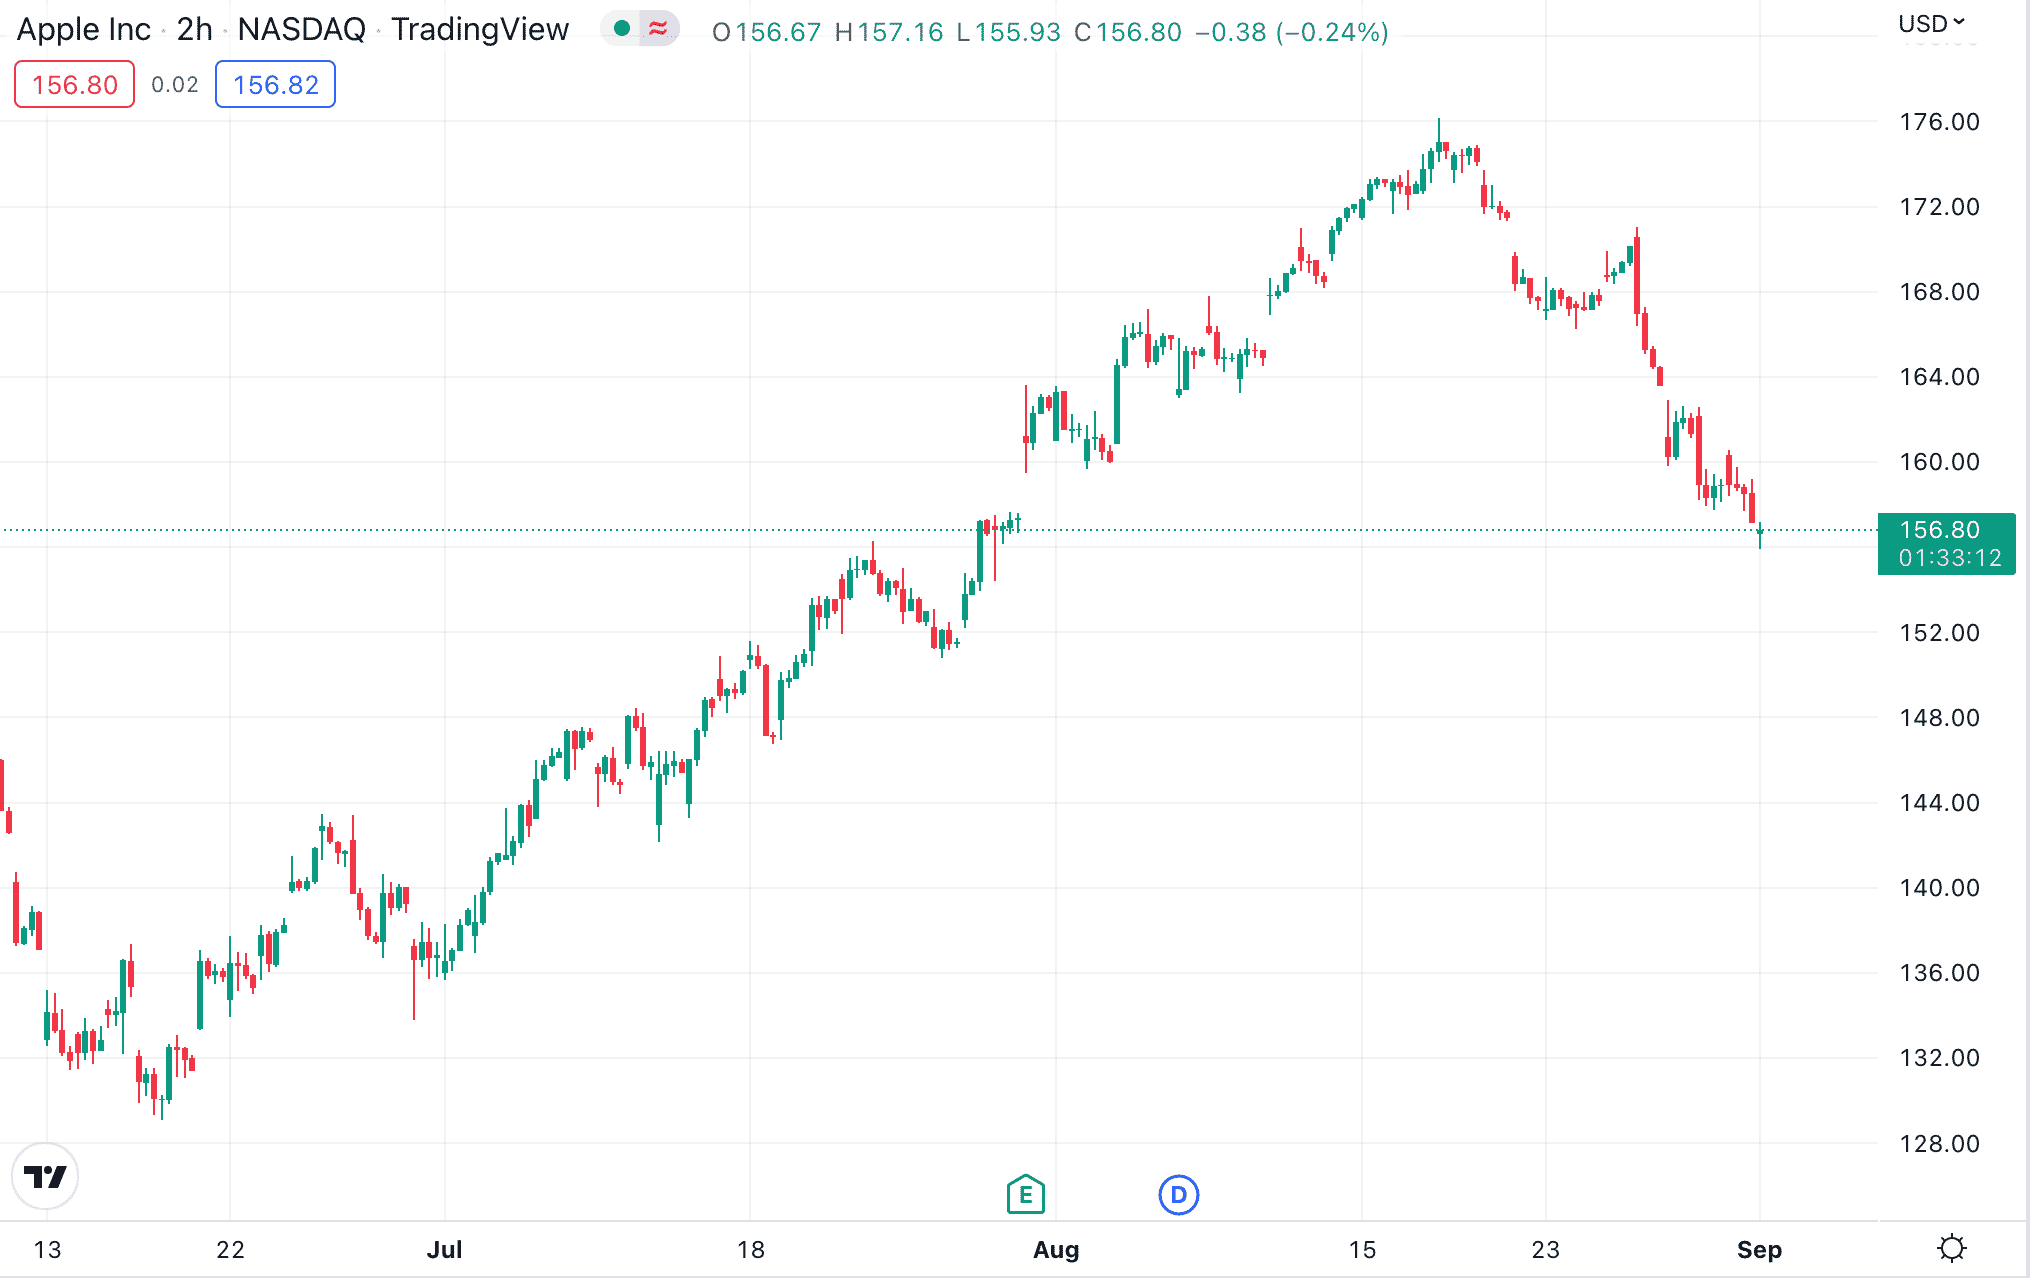
An uptrend happens when the overall price direction of an asset is bullish. An uptrend is made up of higher swing highs and lows – as in the image below. As long the price continues in this direction, the uptrend is deemed intact.
Downtrend
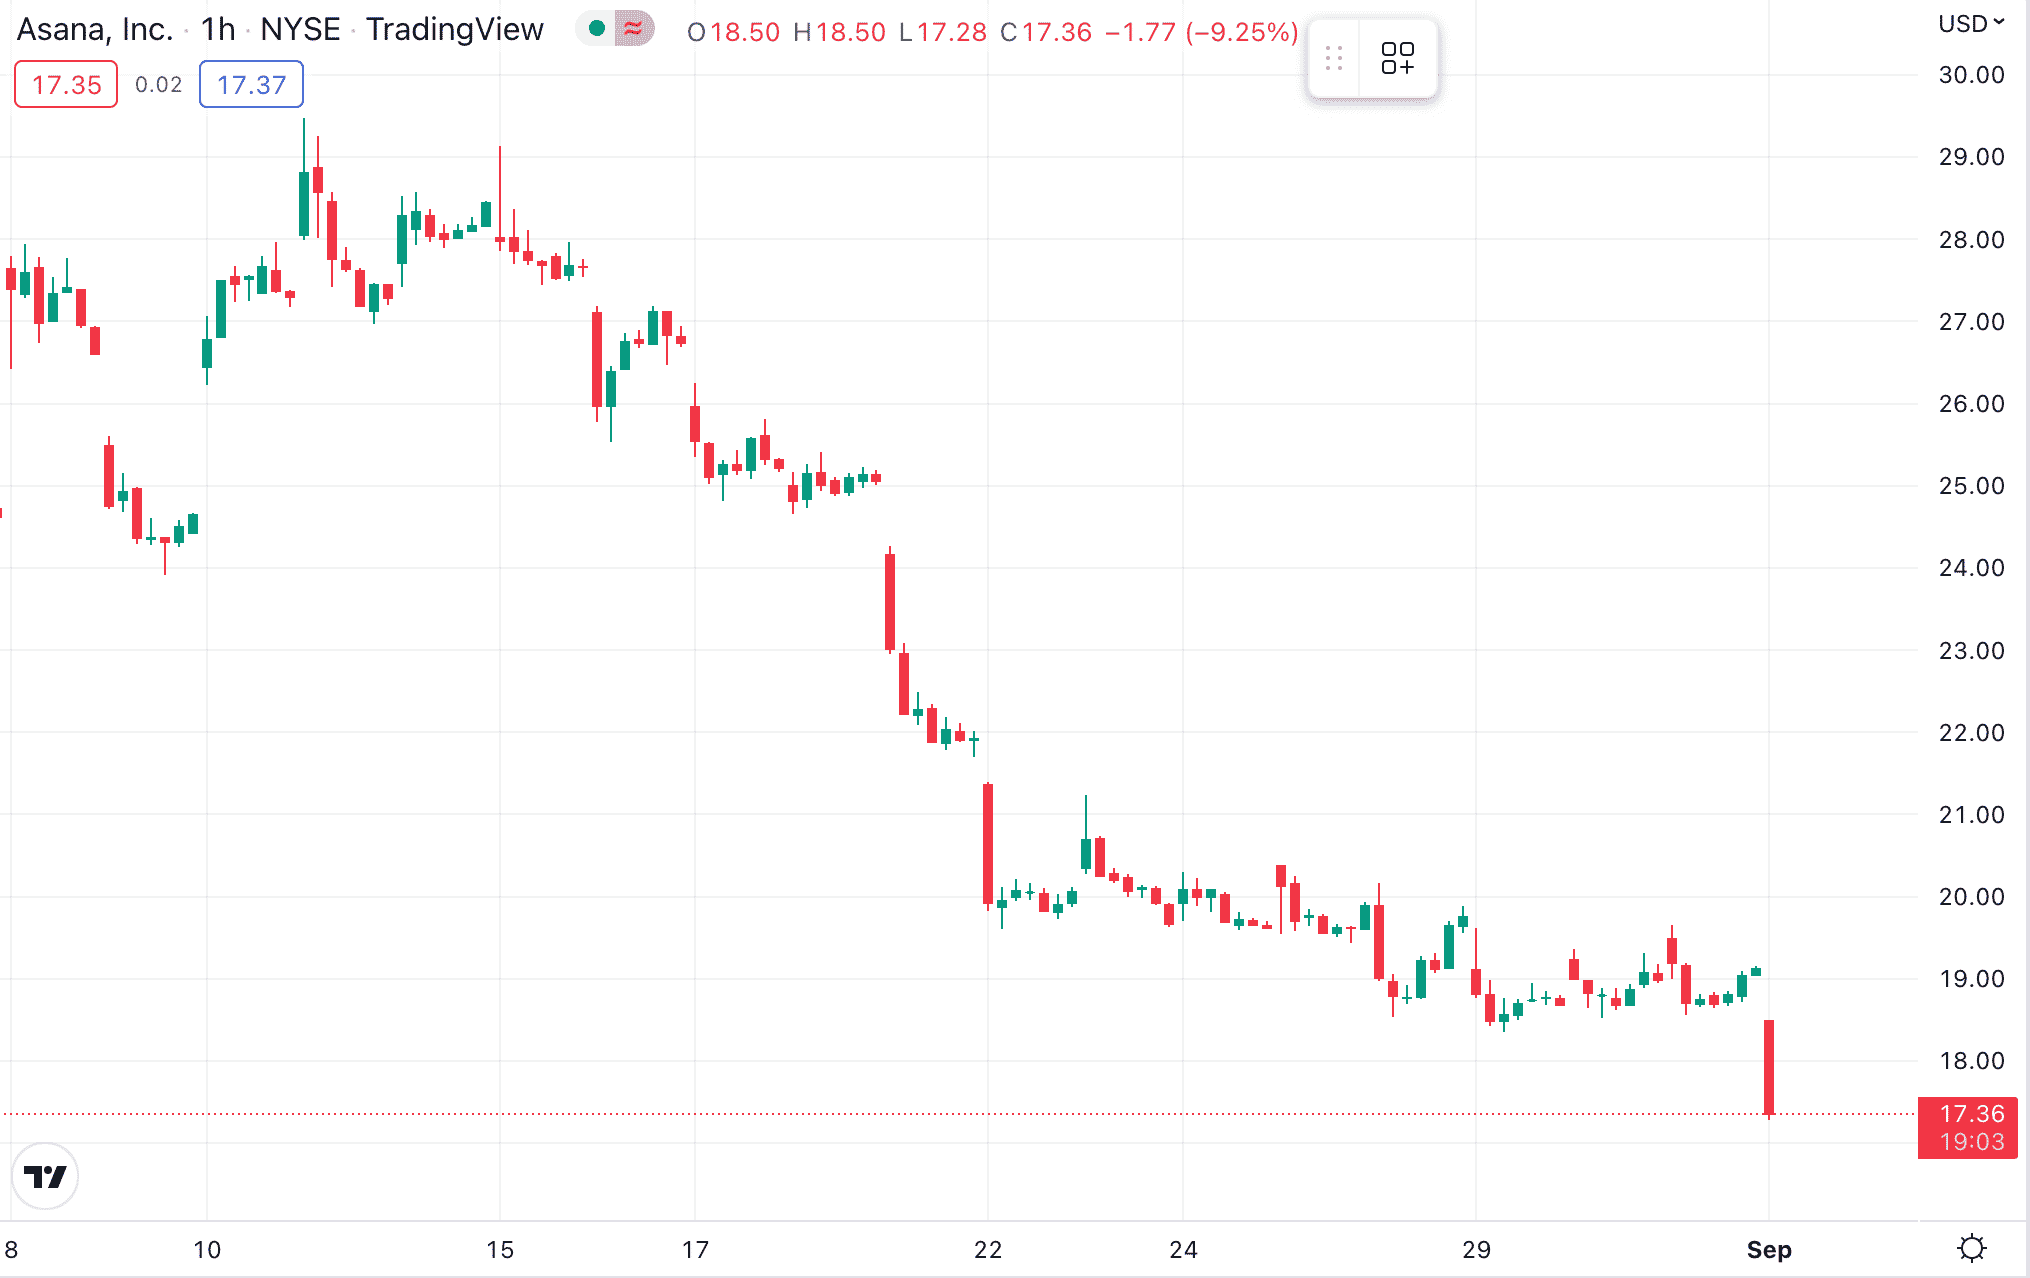
If the price of the asset declines, then this translates to a downtrend. It is the gradual reduction of the value of the asset over a given time.
When considering how to trade a downtrend, investors mostly opt to short-sell the asset. This requires the trader to place a ‘sell’ order first. Then they will exit the position by placing a buy order – ideally at a profit.
Flat Trend
If the price does not move either up or down but rather horizontally, then a sideways trend is observed. This is also called a flat market.
When this happens, the market typically trades within a tight range instead of forming a clear up or down trend. For instance, if a stock is trading at between $50-52 over the course of a month, then it is thought of as a flat trend.
- Flat trends may occur due to several reasons – investors might lose interest, or there might be other economic metrics affecting the market.
- As an example, flat markets may occur a few days before a scheduled event when traders are waiting for an announcement to drop.
- A flat trend does not mean that there are no trading opportunities. In this case, the trends will be short-term, lasting minutes, hours, or days.
Needless to say, the most important step here is to know when a trend will occur and act accordingly.
When a trend line is broken, it can be considered a warning that the broader pattern may be changing – however, traders should confirm this through other strategies and indicators before making a move.
Trend Timelines
Trends can be bullish, bearish, or even sideways. There is no specific time frame for a price movement to be deemed a trend – however, the longer the direction is maintained, the more qualified it becomes.
That being said, what qualifies as a trend will also depend on the specific trader.
For instance:
- For a day trader, a trend has to have a timeframe of fewer than 24 hours. This could be a 4-hour trend trading window or one that lasts just four minutes.
- As day traders open multiple positions within 24 hours, they will be looking for short-term trends.
- For long-term investors, a beneficial trend might be one that lasts for several weeks or months.
The trend trading strategy can be applied for a wide variety of time frames; however, the predictions tend to be more accurate for medium or long-term trading.
When asking what is a trending market? – the answer is that it can be both bullish and bearish. As long as the asset price is moving in the same direction during the specified timeframe, it can be called a trending market.
A Closer Look at Trend Trading
So, now that we have established what is a trend in trading – let us explore this strategy with the help of an example.
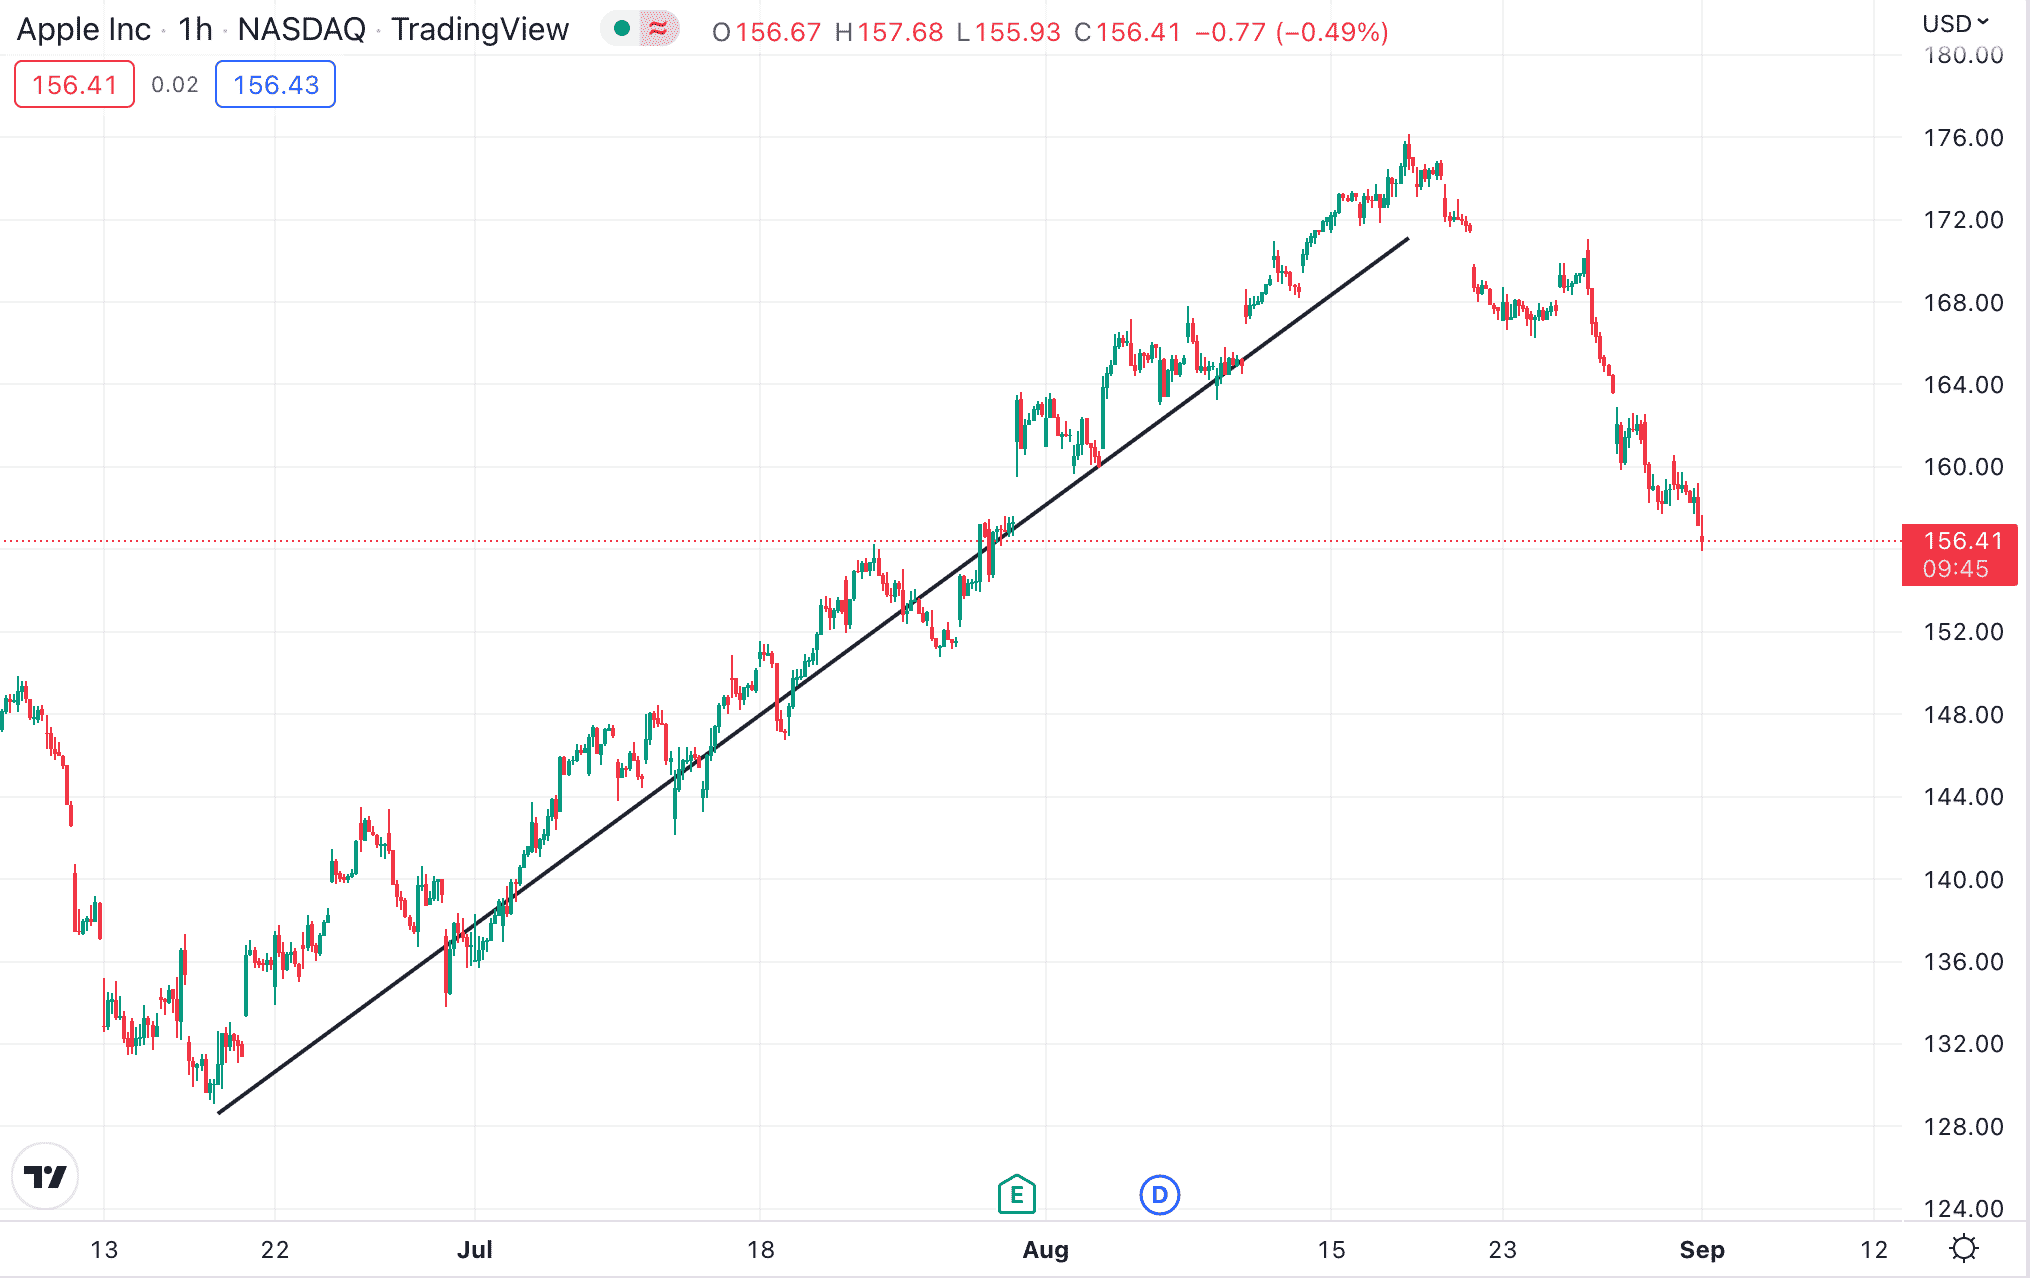
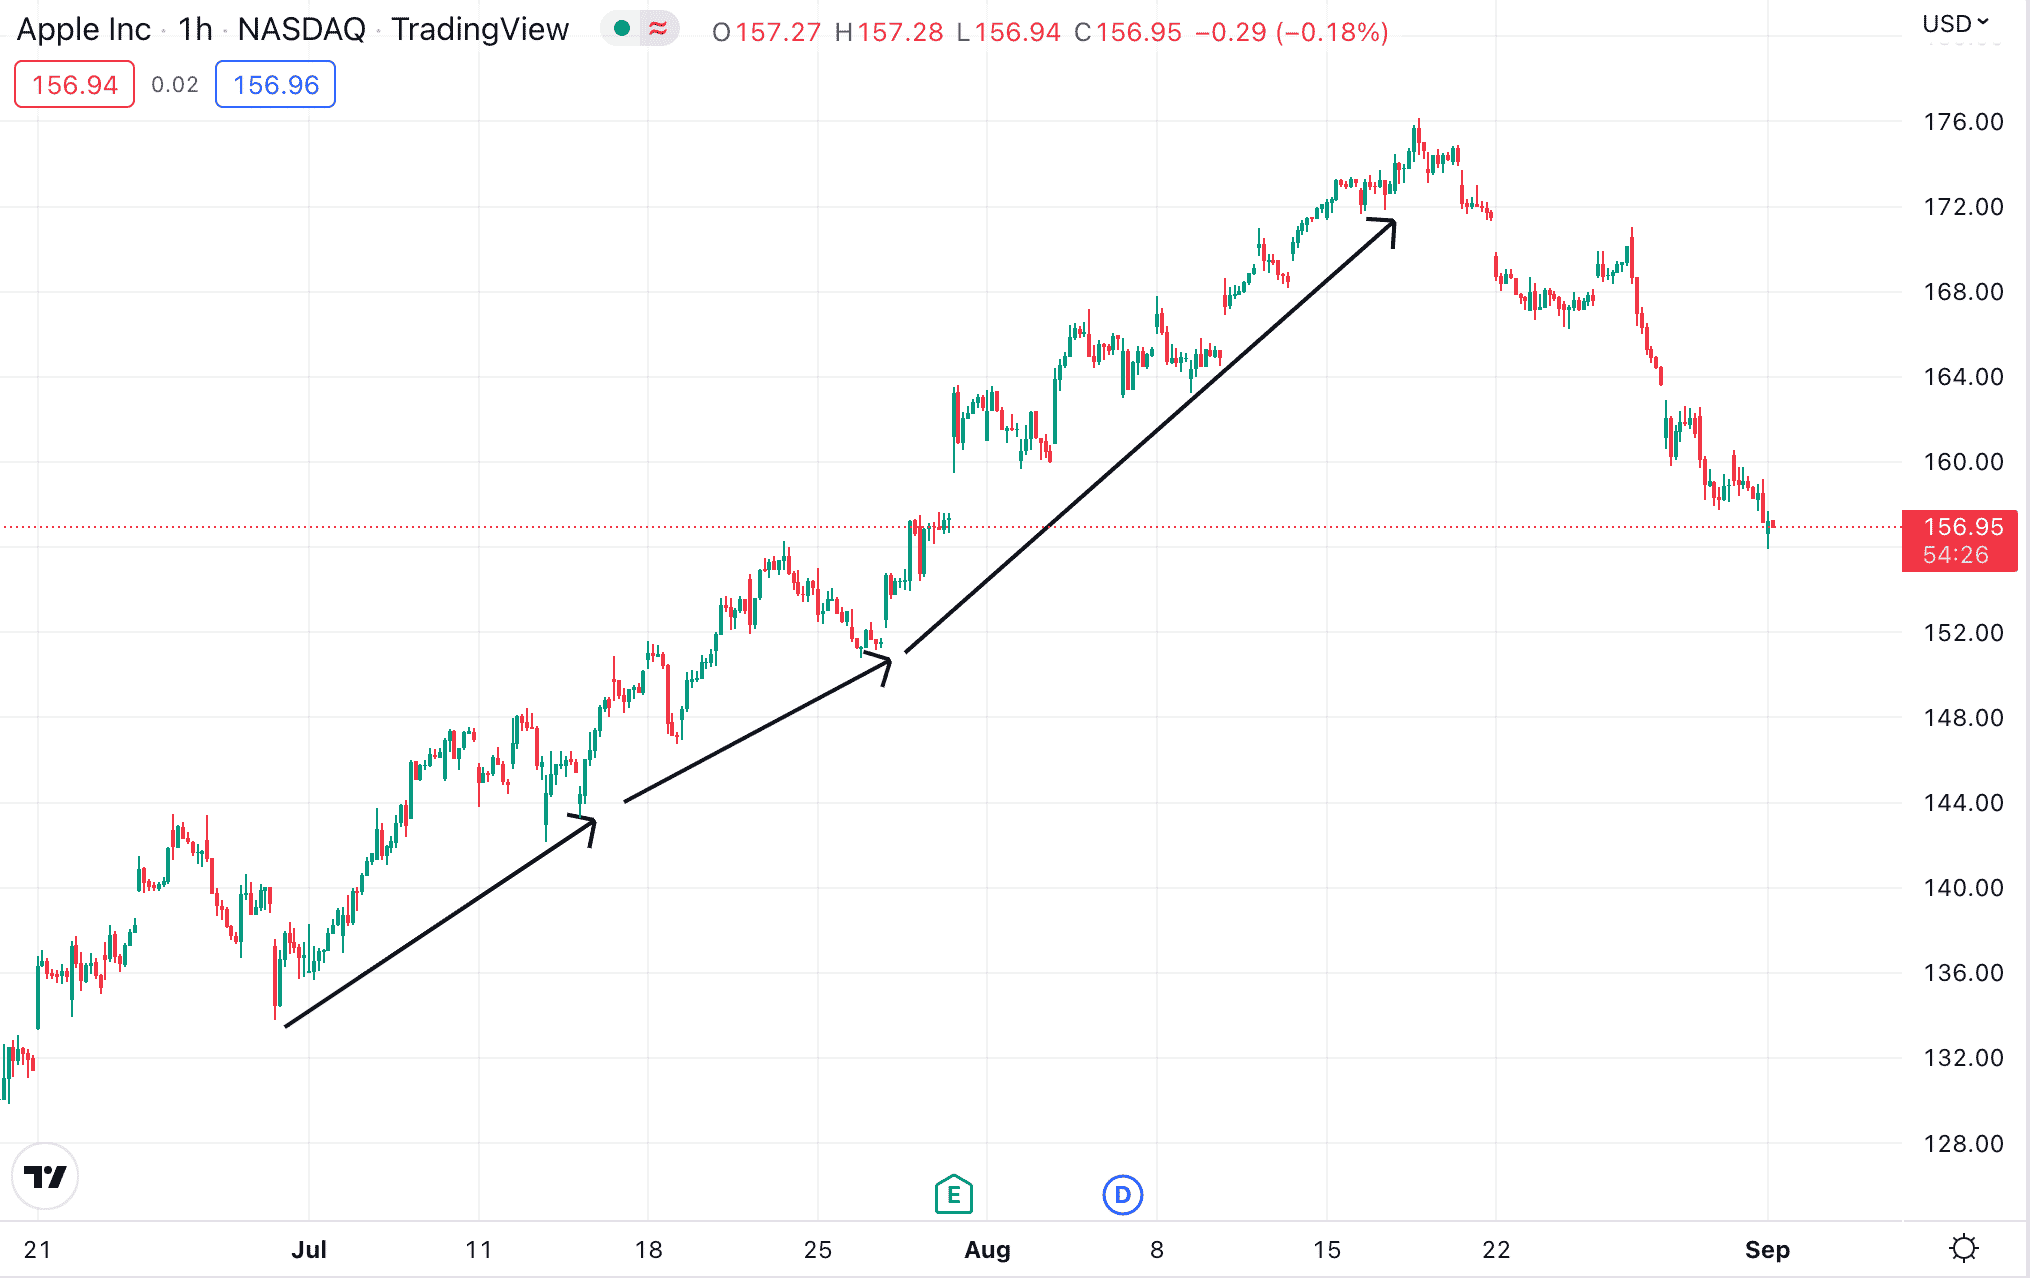
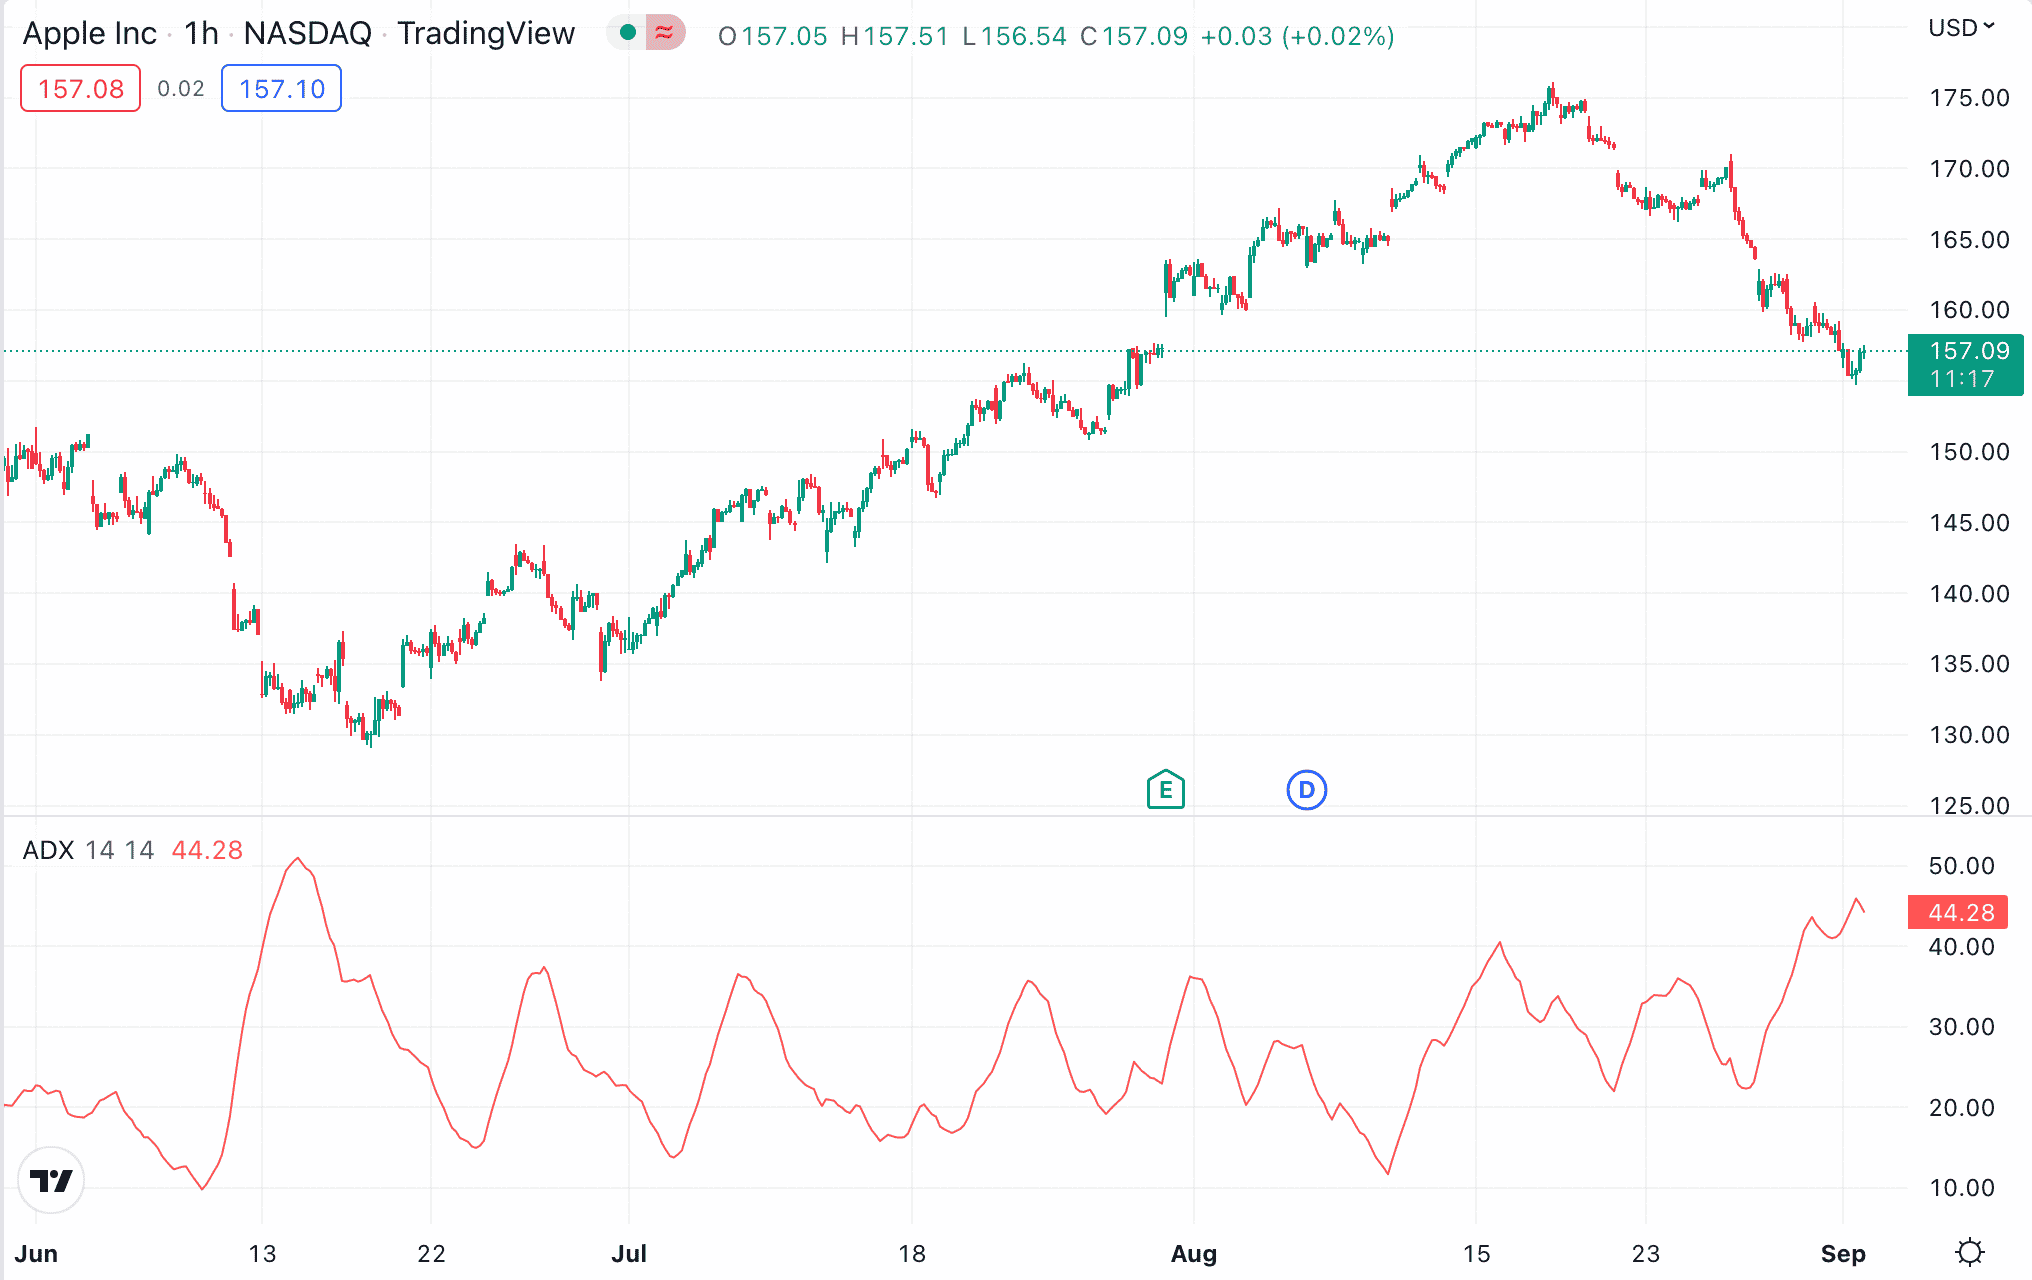
The following Apple Inc chart shows an uptrend. The trend started in the final week of July 2022 and lasted until the third week of August. This trend could be the result of a number of things.
First, Apple stock profited from the general market rally during this period. Second, news broke that Apple is planning to increase its investments in the digital advertising space, which was received positively by the market.
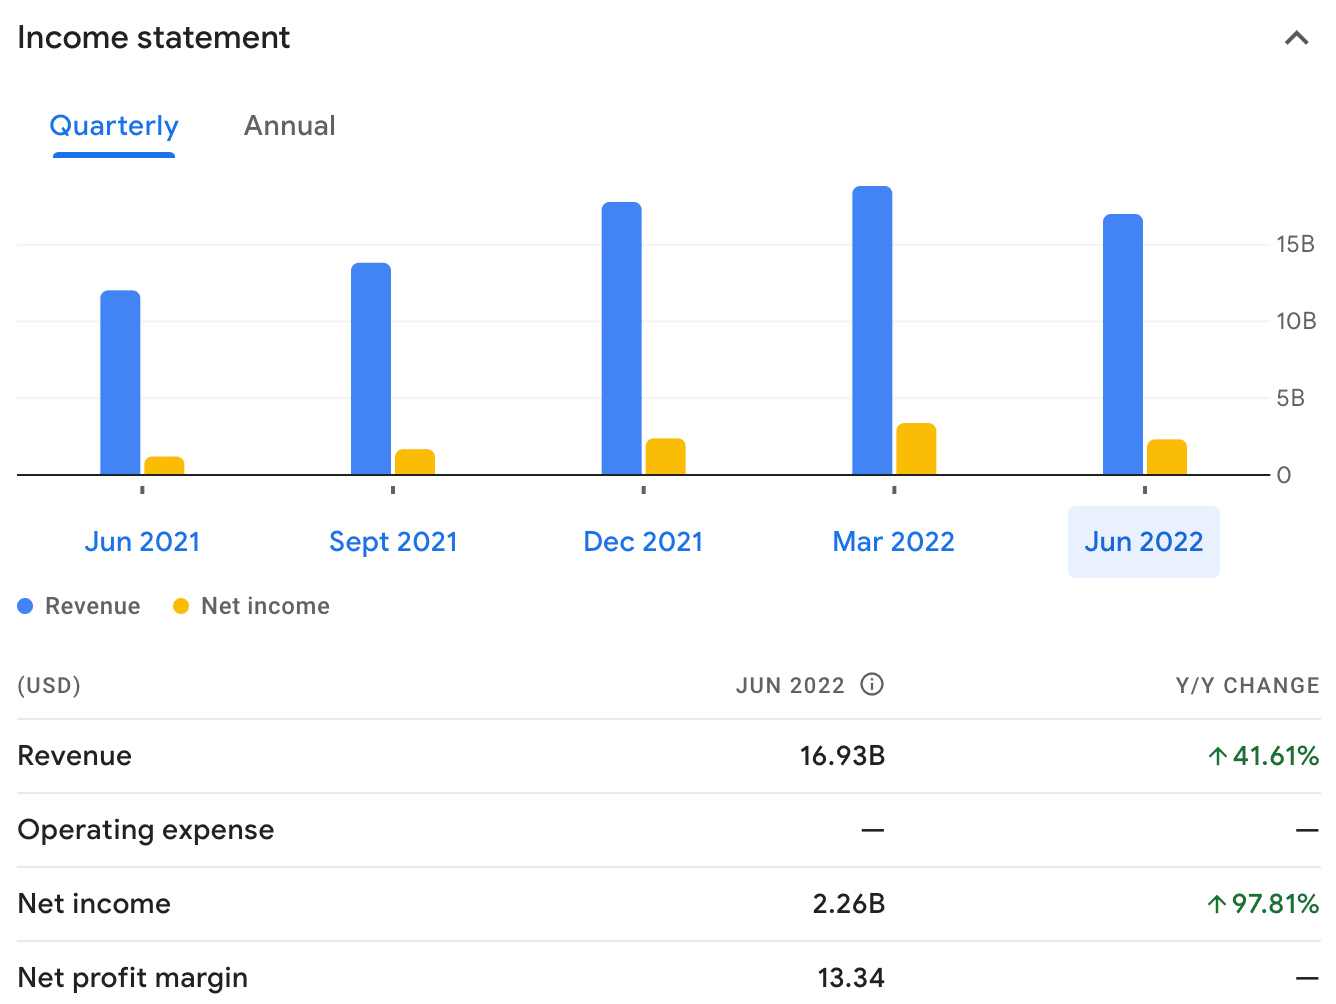
- In addition to this, Apple also reported that its net sales grew in the third quarter of 2022.
- This led to an uptrend, providing opportunities for traders to open long positions.
- However, during this upward movement, the price has also fallen below the trendline several times.
As is evident in the case of Apple – this does not necessarily mean that the trend is about to break.
Instead, the price of Apple stock continued to rise. In this case, the trend can be split into shorter periods to reflect the price action.
However, the trend lasted only for about two months – it started reversing by the end of August. While there is not any particular reason for this trend reversal, many analysts speculate that it is due to the widespread concern over the rising interest rates.
For example, on August 26th, Federal Reserve Chair Jerome Powell indicated that interest rates would continue to rise. This had a negative impact on the stock market, especially for tech companies such as Apple.
Since then, the stock has commenced on its downward trend, opening up short-selling opportunities. Those who were able to identify these trends beforehand will have entered positions accordingly.
Popular Strategies for Trend Trading
Trend traders open a position based on a prevailing or an upcoming pattern. They will keep the position open until the trend shows signs of reversing.
So, when applying this strategy, one of the first and most important things to learn is how to identify a trend. Put otherwise, it is necessary to have an idea of what drives a trend.
There are different ways to identify a trend. While some investors rely on fundamental analysis to predict a trend, others opt for technical research.
Below, we discuss some of the most commonly used strategies to adopt when trading with the trend.
Fundamental Analysis
As we noted above, trend trading is a strategy that can be used across all asset classes. So, when considering how to trade the trend – investors might arrive at their decisions based on fundamental analysis.
In the case of stocks, this type of analysis considers changes in earnings, revenue, business model, and other economic metrics.
For instance, if a company is expected to report high revenues in its quarterly earnings report, this might lead to an uptrend in the market. On the contrary, if the opposite happens, a downtrend may occur.
Similarly, crypto investors might speculate that an uptrend is about to start if a digital token has entered a new partnership with a company.
For instance, when Elon Musk announced that Tesla would start accepting Dogecoin as payment, the price of this cryptocurrency shot up – albeit the trend lasted only for a short while.
Doing fundamental analysis can help investors identify how the market might move. By analyzing historical trends, traders might be able to ballpark future market performance.
Technical Indicators
While financial analysis can indeed offer some insight, many traders prefer to use technical tools to arrive at more accurate predictions.
There are numerous technical indicators that can be used for reading trends – but in our guide, we will focus on the most popular strategies used by traders.
Moving Averages
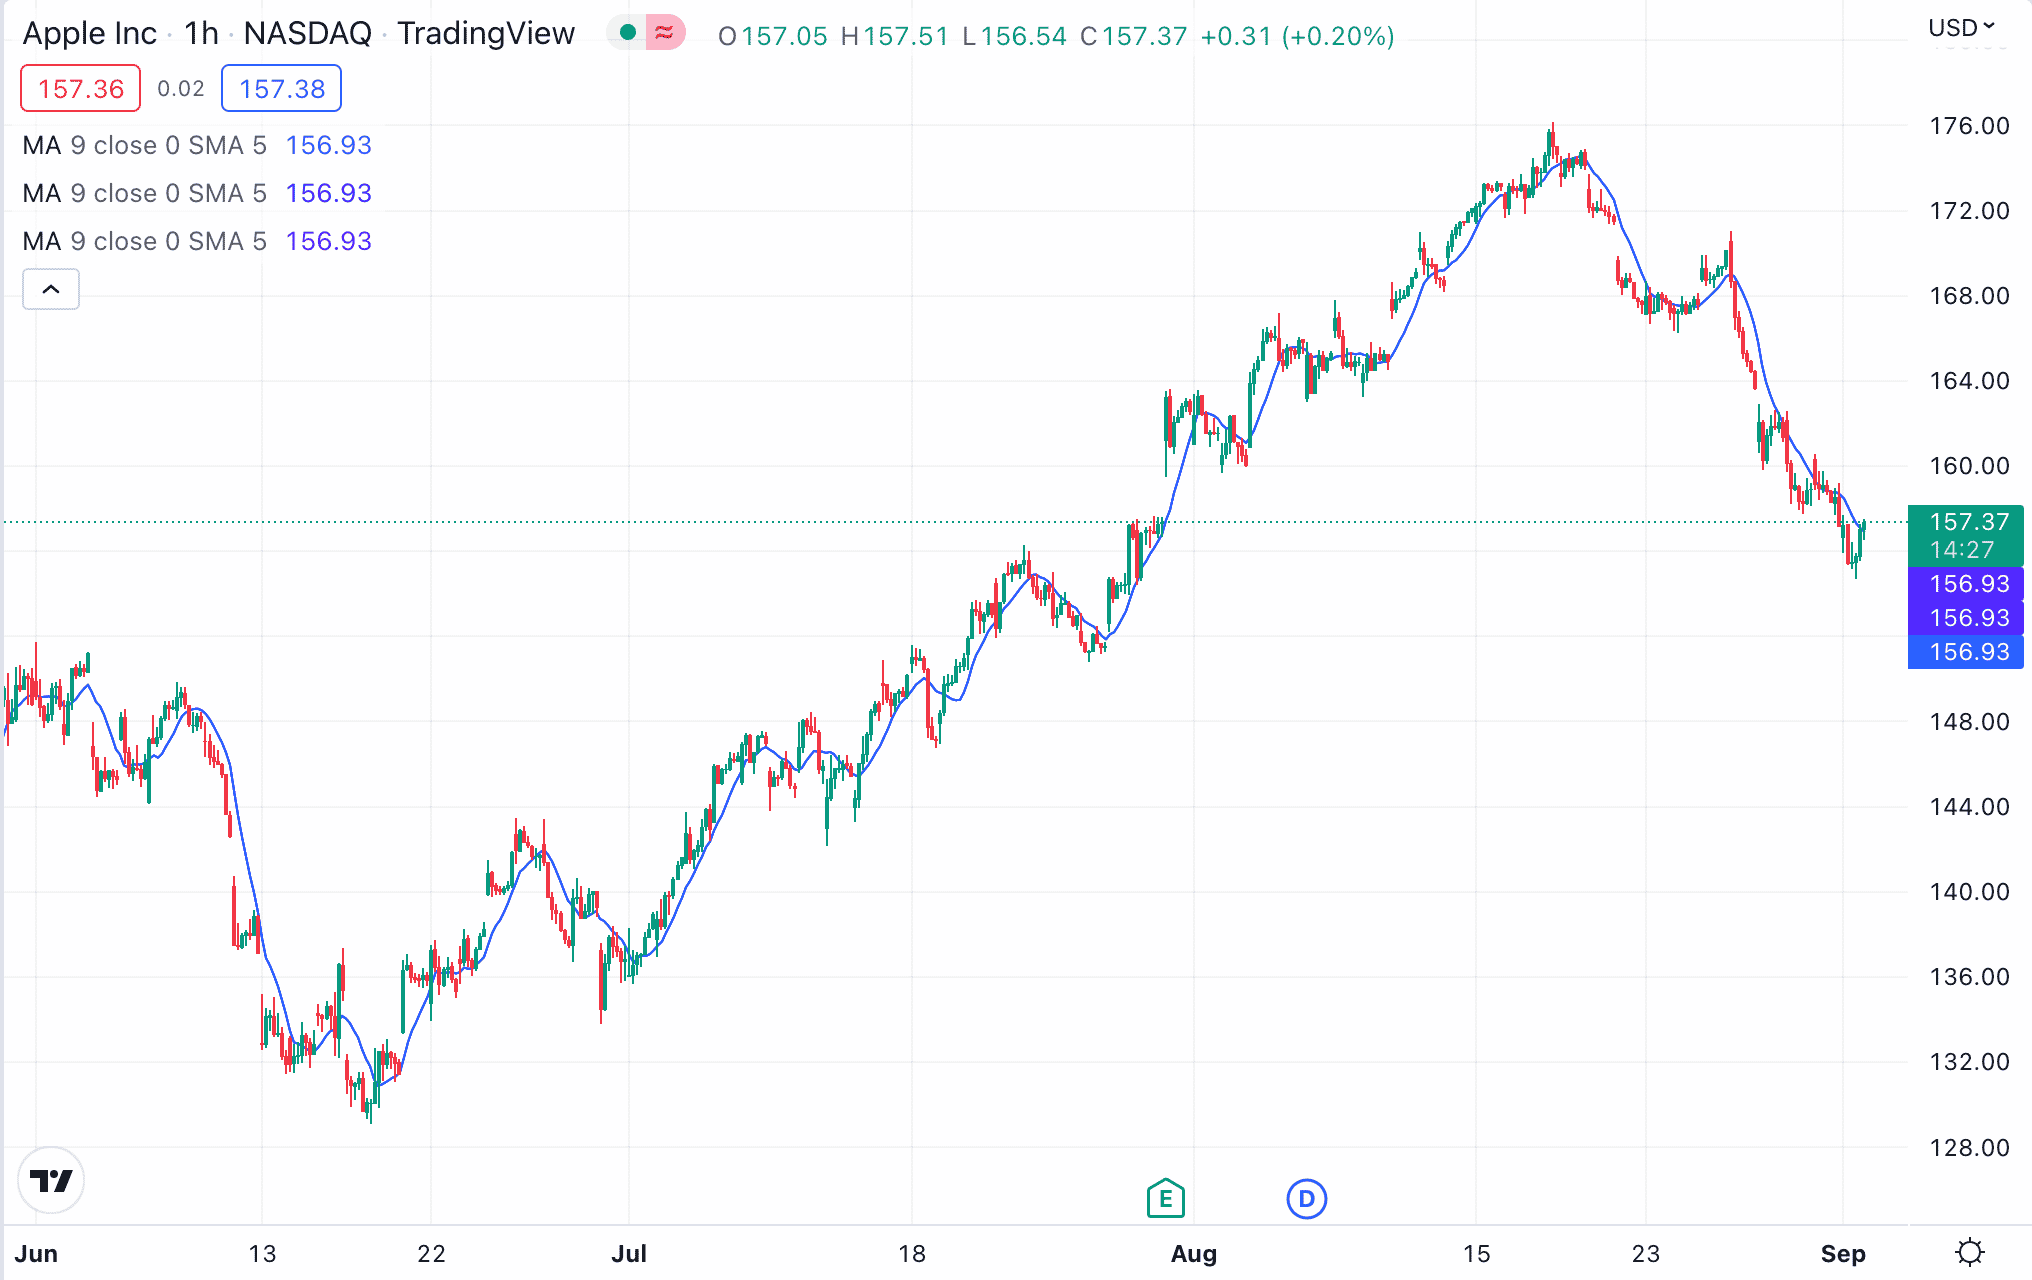
The most commonly used technical indicator for trend trading is moving averages.
These help in establishing not only the trend direction but also the momentum, as well as any possible reversals. Moving averages smoothen the price action by arriving at an average value.
Moving averages can be taken over any specific period of time – be it 30 minutes, 10 days, 2 weeks, or any interval that the trader chooses.
So, how does this help spot a trend?
- In simple terms, moving averages act as a support or resistance for trendlines.
- When price action stays above the moving average, it suggests a general uptrend. In this case, the moving average will act as the support, so the price bounces up off of it.
- On the other hand, if the price action happens below the moving average, then a downtrend is formed. Here, the moving average is the resistance – when the price hits this point, it starts to drop again.
Usually, moving averages are combined with other technical analysis tools to arrive at a decision.
The RSI Trading Indicator
Traders also use momentum indicators and strategies to help find trends in the market.
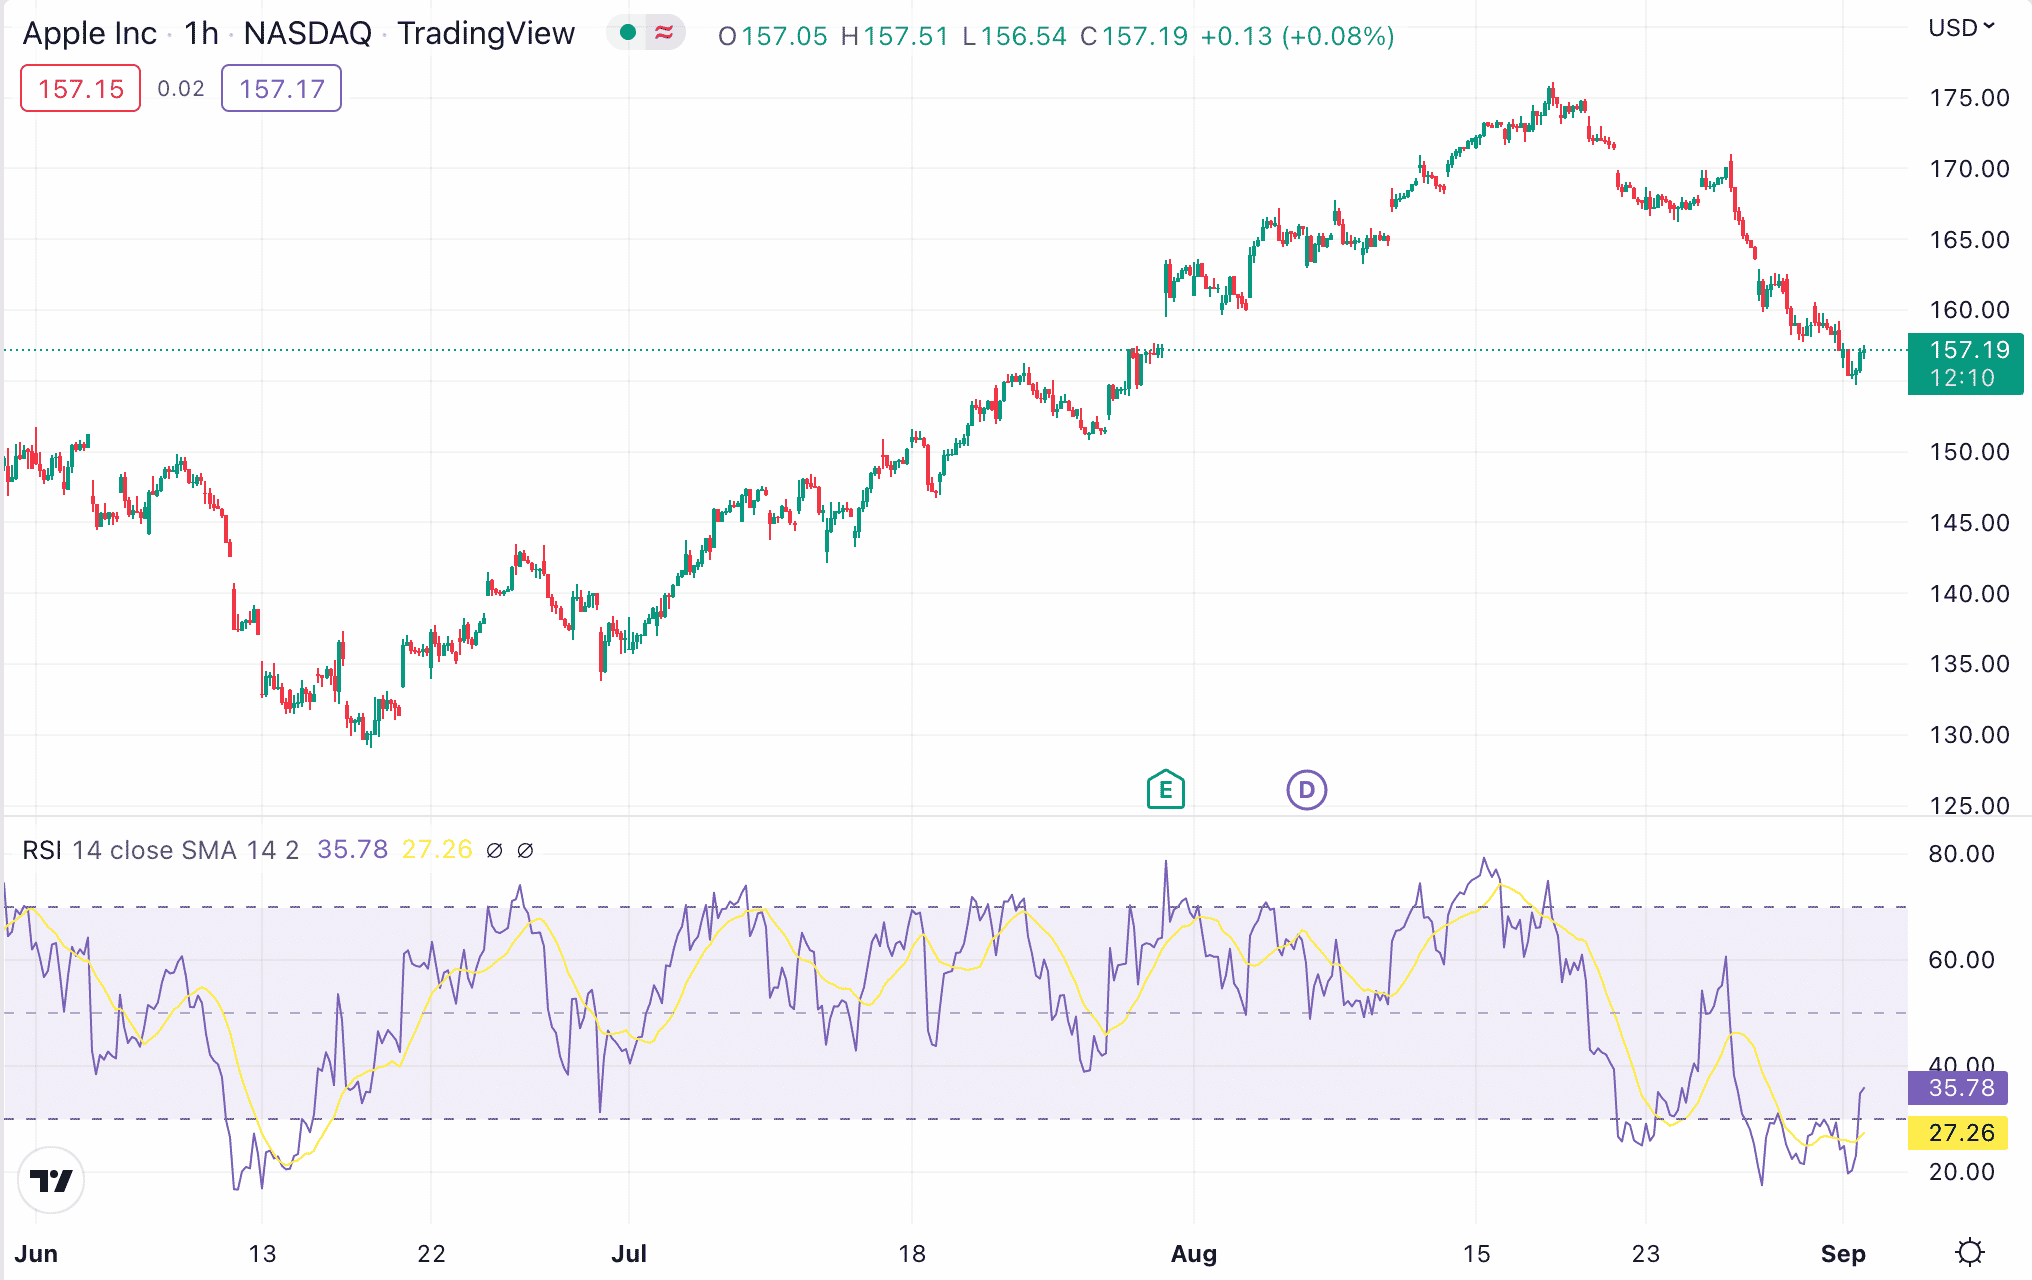
One of the most commonly used indicators is the Relative Strength Index or RSI. This is used hand-in-hand with moving averages.
For example, a trader might look for an uptrend using moving averages and then use the RSI to signal when to enter and exit the market.
For this, the trader might wait for the RSI to rise or drop below a specific point.
- The RSI value ranges between 0 and 100.
- If the indicator is above 70, then the asset is viewed as overbought – a bearish sign.
- When the indicator is below 30, then it is considered to be oversold – or a bullish sign.
- However, traders can set their own RSI levels to determine their own exit and entry points.
Moreover, during trends, the RSI might fall into a broad range. For instance, the RSI might stay above 30 and subsequently hit 70 multiple times.
However, if the RSI can’t reach 70 consecutively during an uptrend without hitting 30, then it might indicate that the pattern has weakened.
Similarly, during a downtrend, if the RSI can’t reach 30 a few times before it strikes 70, then the direction might be reversing.
These guidelines with the RSI can help traders determine the strength of a trend as well as potential reversals.
The ADX Indicator
The Average Directional Index, or ADX, is another indicator used to determine price trends. In fact, when attempting to find what is the best trend indicator – many experienced traders might suggest the ADX.
This is because the ADX helps traders measure the strength of trends. The line on this indicator ranges from 0 to 100.
- If the indicator shows values between 25 and 100, it signals that the trend is strong. The higher the number, the stronger the trend.
- If the value falls below 25, then it suggests a weak trend.
Needless to say, traders prefer to avoid trends that fall below 20. The ability of the ADX to quantify trend strength is the main edge of this indicator.
The ADX also alerts traders of the changes in the momentum of the trend so that they can deploy risk management strategies as needed.
These are only a handful of the technical indicators available for trend trading. Experienced traders will combine several indicators to predict how the market will evolve.
Risks of Trend Trading
Does trend trading work? Yes, it is indeed a time-tested strategy that has helped investors generate profits from the financial markets. That being said, trend trading is not without its risks.
When learning how to trade with the trend, it is important not only to know when to enter the market but also when to close the position before the respective trending line reverses.
If a trader does not spot a weakening trend, they might end up losing money. This is why proper risk management is of utmost importance when trend trading.
On top of this, trend trading also requires knowledge of technical tools and, as such, is best for investors with some experience.
Most trend traders will utilize advanced order types – such as limits and stop-losses – to protect their positions. These orders allow traders to automate their positions to enter the market when the price reaches specific levels.
This way, traders will be prepared to get out of a position before a trend reversal occurs.
That said, the market might not always move based on the predicted trend. A reversal can happen at any time, and traders need to assess their strategy if the market changes unexpectedly.
Where to Start Trend Trading – Popular Trend Trading Brokers Reviewed
Now that we have covered what is trend trading in detail, let us consider which brokers can be used when deploying this strategy.
When choosing the best trading platforms, traders should explore the following aspects:
- Trend trading tools and features
- Types of asset classes supported
- The regulatory standing of the broker
- Trading fees and other charges
- The user experience
- Minimum deposit and trading amount
- Customer service
Below, we discuss a small selection of popular brokers for trend trading.
1. Capital.com – CFD Broker Supporting Multiple Assets

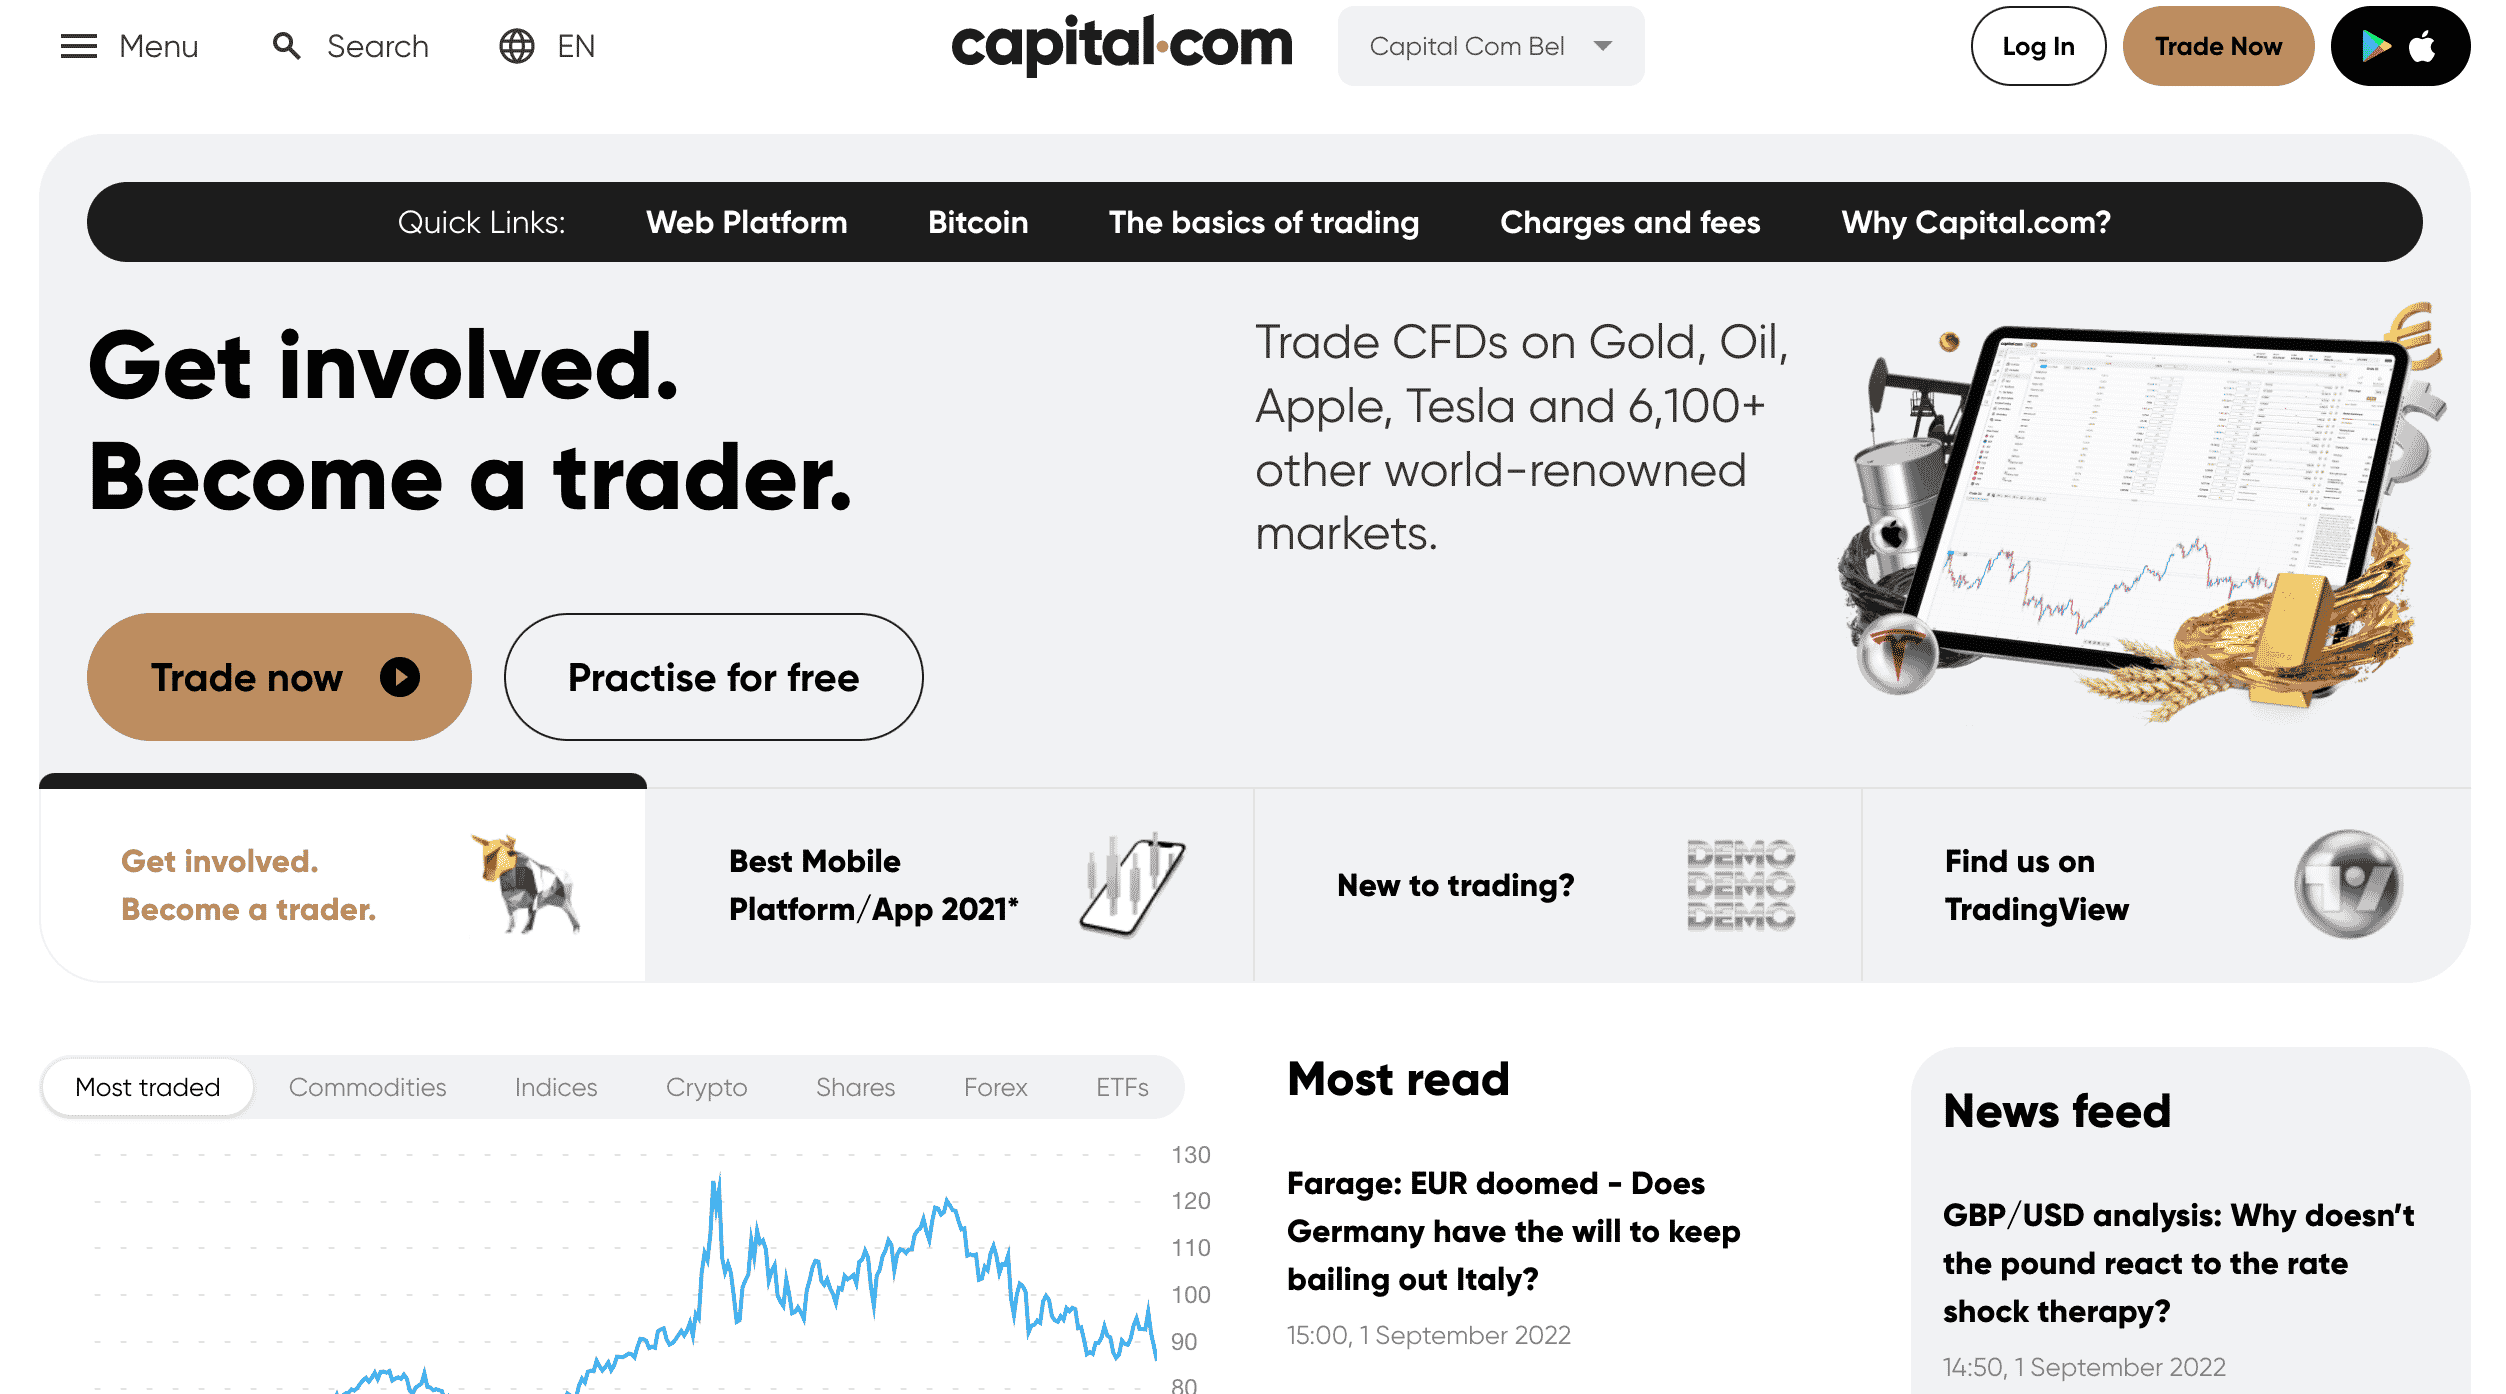
With more than 70 technical indicators and extensive drawing tools, traders will have more control over their market analysis. Moreover, Capital.com offers access to TradingView as well as MetaTrader 4. Furthermore, traders will be able to benefit from in-depth market analysis and other insights.
But bear in mind that Capital.com is a CFD platform, so it does not allow users to take ownership of assets. Instead, traders can speculate on the price direction of the CFD asset, which is a derivative financial instrument. This allows traders to trend trade in both markets – bullish and bearish. Moreover, this platform charges no commissions for trading.
Capital.com also offers educational materials. This platform has a dedicated section that features guides, such as how to day trade stocks, forex, cryptocurrencies, and more. These educational tools are accessible not only to Capital.com users but to everyone.
In addition to this, Capital.com is also one of the most popular paper trading platforms in the market. Its demo account offers risk-free trading, which is a handy tool for all experience levels. Capital.com charges no deposit or withdrawal fees when processing payments.
Funding can be done via e-wallets and credit/debit cards with a minimum deposit of just $20. Bank transfers are also accepted, but users will have to transfer at least $250. Capital.com is regulated by the FCA, CySEC, ASIC, FSA, and NBRB.
Read our in-depth Capital.com review to know more about the broker.
| Minimum deposit | $20 |
| Trading fees | 0% commission + spread |
| Payment Methods | Bank transfer, credit/debit cards, e-wallets |
| Deposit fees | No deposit fees |
80.61% of retail investor accounts lose money when trading spread bets and/or CFDs with this provider.
2. eToro – Popular Social Trading Platform With ProCharts

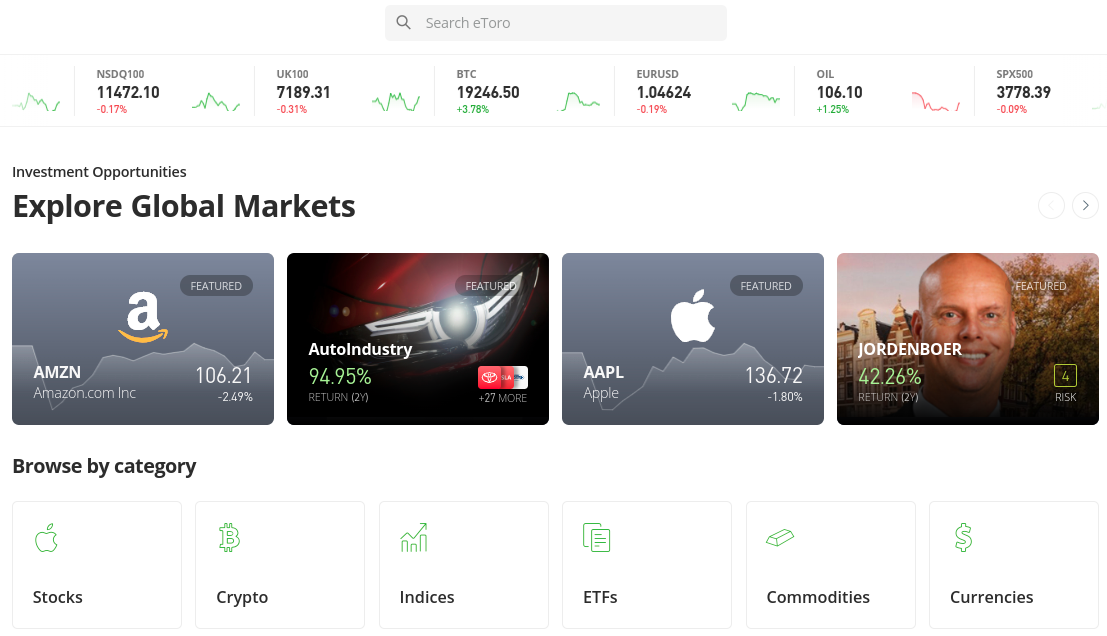
Stocks and ETFs can be assessed on a commission-free basis, and the platform offers competitive spreads for other supported markets. eToro has many educational resources enabling its users to learn how to trade ETFs.
eToro offers an intuitive interface that is simple to use for most trend traders. It comes with customizable charting tools and many technical indicators – which makes it easy for traders to identify the trends in their chosen financial markers. Moreover, users will also be able to control their positions using multiple trading orders – including limit, market, take-profit, and stop-loss.
In addition to this, eToro is also one of the best paper trading platforms, with a demo account feature. This is accessible to all its users and comes loaded with $100,000 in paper money. The demo account also offers access to technical indicators and charts; therefore, users can test their strategies here first and then switch to the real portfolio to place trades.
Another aspect that makes eToro popular among investors is that it is a social trading platform. This means that users of the platform can share their market sentiments with other traders. eToro also supports Copy Trading, which allows users to automate their portfolio based on the positions opened and closed by other traders.
With this tool, users can pick the investor they wish to copy, and the investment amount (minimum of $200), and eToro will automatically execute the orders – as they are placed by the chosen trader. This allows traders to adopt a completely passive strategy when investing. eToro processes USD payments for free and requires a minimum deposit of only $10.
Likewise, eToro also comes with Smart Portfolios, which are baskets of different assets – such as stocks and cryptocurrencies. So, if a user is unsure of how to invest 10k, for instance, they can choose different Smart Portfolios to diversify across multiple markets. Like Capital.com, eToro is heavily regulated and holds licenses from the SEC, ASIC, FCA, and CySEC.
| Minimum deposit | $10 for US and UK users, $50 elsewhere |
| Trading fees | 0% commission + spread for stocks and ETFs, 1% for crypto, spread-only for other markets |
| Payment Methods | Bank transfer, credit/debit cards, e-wallets |
| Deposit fees | No deposit fees for USD payments, 0.5% for other fiat currencies |
Your capital is at risk. 78% of retail investor accounts lose money when trading CFDs with this provider. Trend trading is a strategy that varies from one trader to another. For long-term investors, a trend might mean an upward price movement that lasts for months or years. That being said, there are certain cases where an investor might be able to trade cryptos without having to follow the trend at all. This strategy is not without its risks – as the cryptocurrency can lose value after its exchange listing. However, by finding the right DAO crypto projects, investors will be able to mitigate the risk to an extent. This brings us to the question – what are the best crypto presales to invest in right now? So, why should Tamadoge be of any interest to trend traders? During the presale, Tamadoge tokens can be purchased at a discounted price. For instance, at the beginning of the presale, investors could buy 100 TAMA tokens with 1 USDT. At the time of writing, 1 USDT will get investors 40 TAMA tokens. As the presale progresses, the price will continue to go up. This means that when the token is finally listed on an exchange, early investors will be able to sell their TAMA at a profit. Moreover, Tamadoge seems to have plenty of room to grow. Crucially, Tamadoge is building a broader ecosystem that comes with lots of utility. For instance, the platform has a P2E game that is integrated with the metaverse. As such, TAMA tokens function as transactional coins in this ecosystem and will be used by players to buy in-game assets. As the platform expands, TAMA tokens will also have other use cases. To buy Tamadoge, investors can visit the project website; but first, they will need to have a crypto wallet that is funded with Ethereum or USDT coins. These cryptocurrencies can be purchased via a broker such as eToro – which we reviewed above. The TAMA tokens purchased can be claimed via the Tamadoge website once the presale ends. Ultimately, investors hoping to find an uptrend in the crypto market might want to check out Tamadoge and see if the digital tokens represent a good addition to their portfolio. In this guide, we explained what is trend trading and how to use this strategy to find opportunities in the financial market. We have also explored technical indicators that can help traders identify market trends. While trend trading can be profitable, it is a strategy best suited for those with prior experience in this space. It requires a good knowledge of technical tools as well as a thorough grasp of risk management to avoid potential losses. For beginner investors, it might be easier to consider buying presale cryptos – like Tamadoge. This is because there is a possibility that the price of the crypto will go up at the time of its exchange listing – offering a chance for early investors to make a profit. Tamadoge - The Play to Earn DogecoinTrend Trading vs Presale Cryptos
Tamadoge – Best Crypto Presale of 2023

Conclusion
FAQs
Does trend trading work?
What is trend following trading?
What are the 3 types of trends?
How do you use trend trader strategy?
What is counter trend trading?
Why is a trend important in trading?
Is trend trading profitable?
What is a trend in stocks?
